article thumbnail

Big Data Analytics in eLearning: Aspects Everyone Should Know

Smart Data Collective

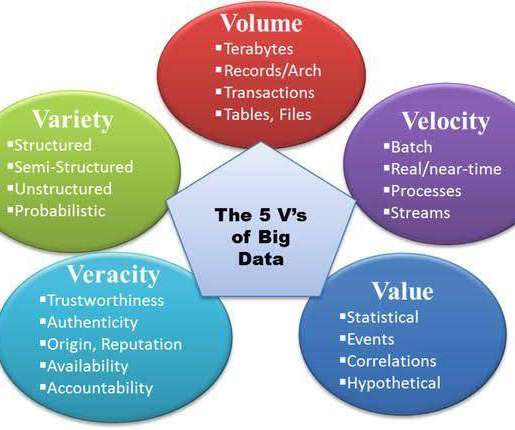
Big data is large chunks of information that cannot be dealt with by traditional data processing software. Big data analytics is finding applications in eLearning. By analyzing big data, Edutech businesses discover interesting ways to revolutionize learning as we know it.

Big Data 302
article thumbnail

How to Present Data to a Non-Technical Audience

Smart Data Collective

When you’re presenting data analytics or any technical information to a non-technical audience, it can be difficult. You have to think about the components of a good presentation in general, but also how to simplify complex subjects and information and make them resonate with your target audience. Data Visualization.

Insiders

Sign Up for our Newsletter

This site is protected by reCAPTCHA and the Google Privacy Policy and Terms of Service apply.

article thumbnail

The Fascinating Role of Data Visualization and Techniques for Assorted Variables

Smart Data Collective

And since every aspect of the organization creates data, which is relevant to the businesses to understand the whys and whens in the processes, companies are in a rush to gain the ability to capitalize on what data has to offer. The classification of data. Types of data. There are two types of data.

article thumbnail

Data Analytics Lifecycle Phases

The BAWorld

The Data Analytics Lifecycle is a diagram that depicts these steps for professionals that are involved in data analytics projects. The phases of the Data Analytics Lifecycle are organized in a circular framework, which is referred to as the Data Analytics Lifecycle. Click below to know more.

article thumbnail

Do you need to excel in data analytics before moving into a BA role?

Analysts Corner

What I did was something undigestible to me as well — I completed online courses in Excel, SQL, Python, Data Visualization, Data Analysis process, etc. I also had 2–3 interviews for a data analyst role but was not able to clear it. They are the ones who are involved specifically in the descriptive analysis of the data.

article thumbnail

What, Why, and How of Data Visualization

The BAWorld

Data Visualization. Did you know visualization has been in use since (and well before that as well) 1824 AD to develop an Egyptian map – the Turin Papyrus Map. Every data set tells us some story, but we need practical tools to find and communicate the story’s purpose with the stakeholders.

article thumbnail

How Data Analytics Can Change the Way In-House Legal Departments Do Business 

Smart Data Collective

Increasingly, though, brands and businesses of all sizes expect their legal representatives to leverage and report out – data the same way as the rest of the company. As a result, big law firms have implemented data analytics a top-of-mind priority for in-house attorneys. What is Legal Analytics?