

Examples of Using Kanban Boards with Data Visualization Tools
Smart Data Collective
NOVEMBER 2, 2021
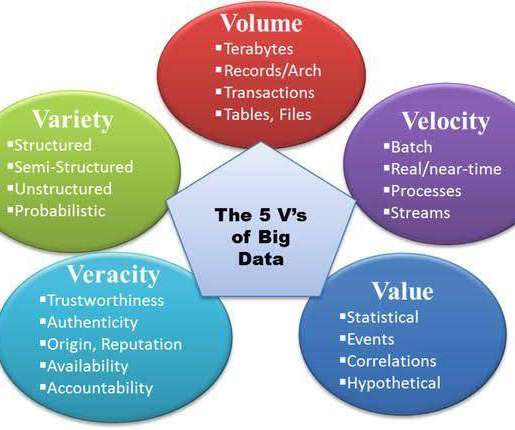
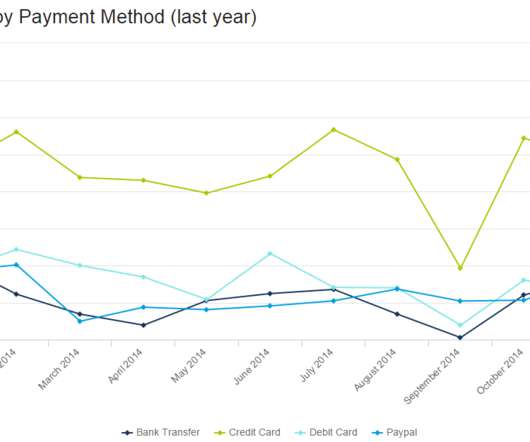
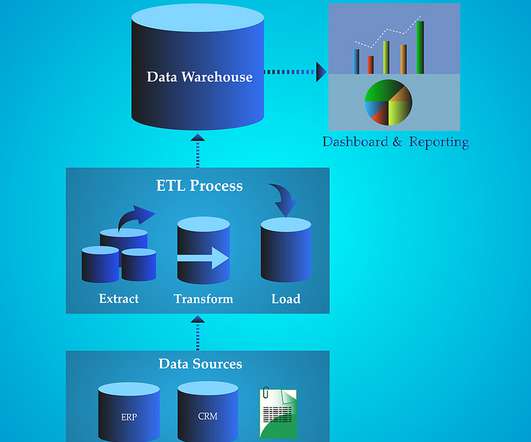
Data analytics technology has become an integral part of organizational management. There are a lot of different ways that big data can help companies streamline certain processes and resolve various challenges that they face. The advent of data visualization has made it easier than ever.


Let's personalize your content