

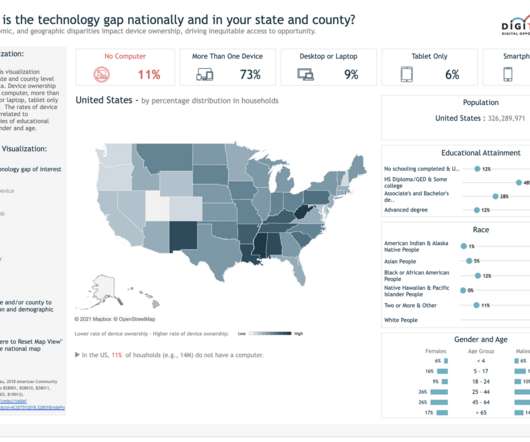
Mapping technology gap data to address and eliminate the digital divide
Tableau
OCTOBER 14, 2021
October 14, 2021 - 11:00pm. October 15, 2021. In the work to close the digital divide in the U.S., Digitunity’s Technology Gap Map TM has become a powerful visualization of the racial, socioeconomic, and geographic disparities impacting device ownership and driving inequitable access to opportunity. Channing Nesbitt.


Let's personalize your content