Remove what-why-and-how-of-data-visualization
article thumbnail

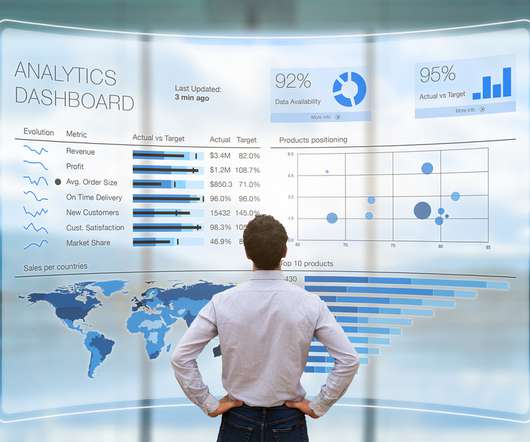
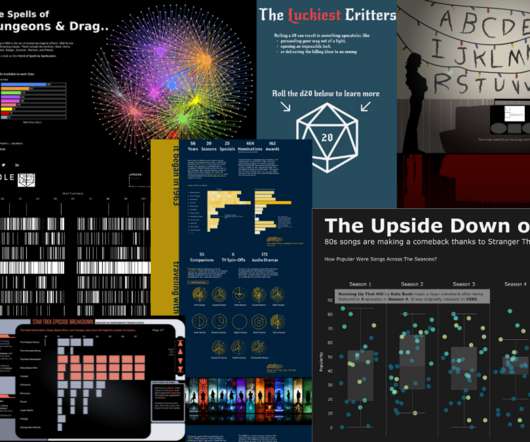
What, Why, and How of Data Visualization

The BAWorld

Data Visualization. Did you know visualization has been in use since (and well before that as well) 1824 AD to develop an Egyptian map – the Turin Papyrus Map. Terabytes and petabytes of data generated every day must be analyzed to get insights to be valuable. Creating Good Visualizations.

article thumbnail

Exploring Iris Data Visualization with Seaborn’s Violin Plot in Python

Analysts Corner

Introduction Data visualization is an essential skill for anyone who wants to explore and understand large datasets. One of the most popular libraries for data visualization in Python is Seaborn. In this article, we will focus on understanding how to use Seaborn’s violin plots to visualize the Iris dataset.

Insiders

Sign Up for our Newsletter

This site is protected by reCAPTCHA and the Google Privacy Policy and Terms of Service apply.

article thumbnail

Good UX Design Principles Must Be Predicated on Big Data

Smart Data Collective

That is why you have to know the good UX design principles. Big data technology has transformed the web design and e-commerce professions in recent years. Big data has been especially valuable in the field of user experience optimization. Big Data is Vital to UX Design. Online businesses are projected to spend over $10.7

Big Data 330
article thumbnail

Is Artificial Intelligence Setting A New Standard For Web Design?

Smart Data Collective

One poll showed that 61% of companies found that AI and machine learning were their best data investments. According to content marketing statistics, 32% of marketers say visual images are the most important form of content for their business, which is probably why you’re here. How AI is Changing the Nature of Web Design.

article thumbnail

Why Game Studios Should Exploit Visual Analytics | BizAcuity

BizAcuity

Inability to get player level data from the operators. It does not make sense for most casino suppliers to opt for integrated data solutions like data warehouses or data lakes which are expensive to build and maintain. As a result, they are not able to see how their games are performing. The Data Strategy.

article thumbnail

How to Bring Presentation Data to Life with Powered Template

Smart Data Collective

We have talked in the past about the importance of data visualization in business. However, many companies are struggling to figure out how to use data visualization effectively. One of the ways to accomplish this is with presentation templates that can use data modeling. Keep reading to learn more.

article thumbnail

Analyst’s corner digest #19

Analysts Corner

What a year it has been! People are naturally curious about the AI (can you imagine how much this field has progressed recently!) and how it is going to affect the BA profession. The realistic news, the BAs who know how to use AI will replace the BAs who do not. Top stories published in November — December 2023 Hi there!