article thumbnail

How Big Data Impacts The Finance And Banking Industries

Smart Data Collective

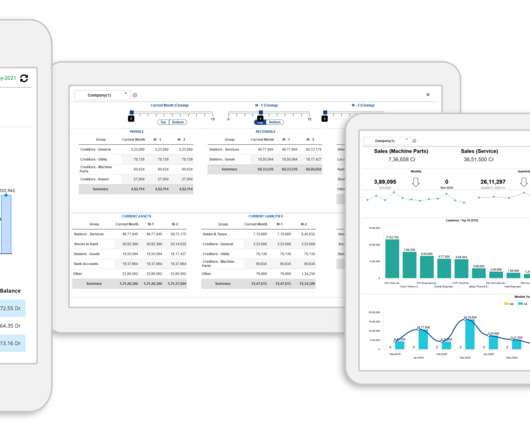
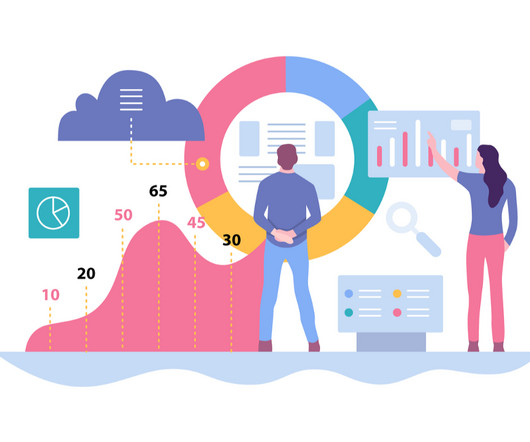
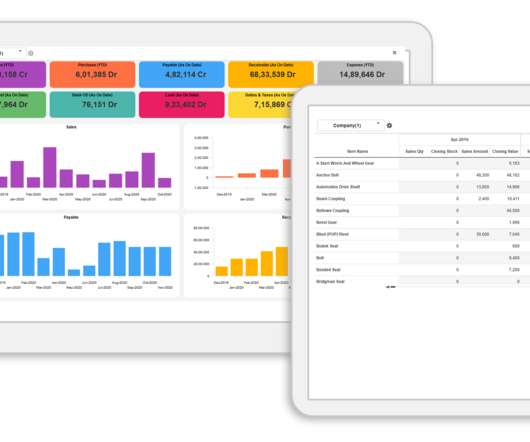
Nowadays, terms like ‘Data Analytics,’ ‘Data Visualization,’ and ‘Big Data’ have become quite popular. Typically, this approach is essential, especially for the banking and finance sector in today’s world. Right now, Big Data tools are continuously being incorporated in the finance and banking sector. The Role of Big Data.

Banking 355
article thumbnail

DirectX Visualization Optimizes Analytics Algorithmic Traders

Smart Data Collective

Learn how DirectX visualization can improve your study and assessment of different trading instruments for maximum productivity and profitability. Let’s dive right into how DirectX visualization can boost analytics and facilitate testing for you as an Algo-trader, quant fund manager, etc. But first, What is DirectX Anyway?

Insiders

Sign Up for our Newsletter

This site is protected by reCAPTCHA and the Google Privacy Policy and Terms of Service apply.

article thumbnail

Financial data visualizations - how they help businesspeople communicate

Phocas

To make business decisions with spreadsheets, the finance team has to pore over thousands of rows of data. But when the same financial data is consolidated using data analytics and presented in a visual format —it’s easier to analyze and communicate the insights with the whole team.

article thumbnail

The Evolving Role of Analytics in Strategic Financial Management

Smart Data Collective

Analytics technology is becoming integral to the field of finance. Strategic Financial Management or strategic finance is a process to help a company’s finances. I will detail the role of analytics in strategic financial management and how mosaic finance can help you throughout the process! What is Strategic Finance?

Finance 229
article thumbnail

What, Why, and How of Data Visualization

The BAWorld

Data Visualization. Did you know visualization has been in use since (and well before that as well) 1824 AD to develop an Egyptian map – the Turin Papyrus Map. With the overwhelming volume and rate at which data grows, it is almost impossible to do it without visual help. Creating Good Visualizations.

article thumbnail

Inform Your 2021 By Looking At the Most Popular Finance Content of 2020

Insight Software

These enable them to have a visual view of what’s going on, for quicker understanding. And, as always, finance teams always have an interest in polishing up their Excel skills, so they can focus on the results of the calculations, not on how to perform the calculation in the first place. 2020’s Most Talked About Topic: Cash Flow.

Finance 105
article thumbnail

Attract and keep the best finance talent with financial analysis software

Phocas

There is a global shortage of finance talent. Yet there is also a growing push toward having a more modern finance team that can be ready for anything, can quickly share up-to-date numbers and coach others in the business about financial performance.