Remove Data Visualization Remove Documentation Remove Reference Remove Visualization
article thumbnail

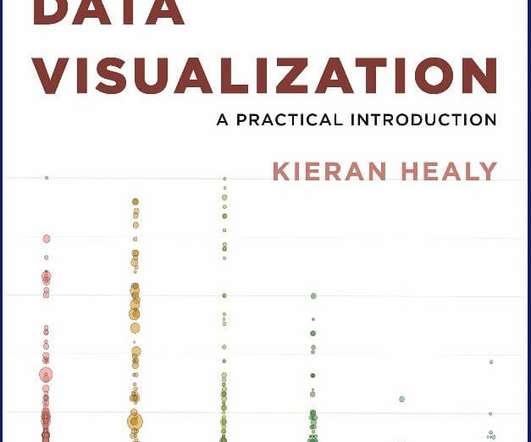
The Top 20 Data Visualization Books That Should Be On Your Bookshelf

Data Pine

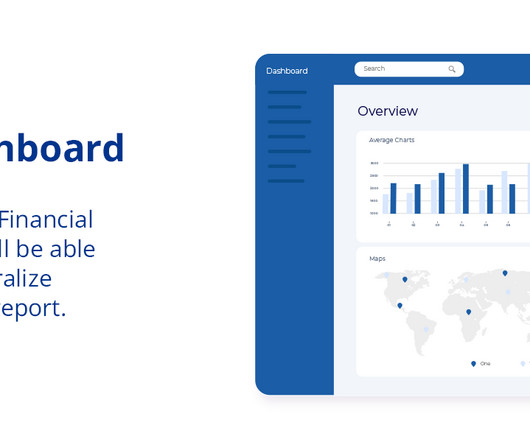
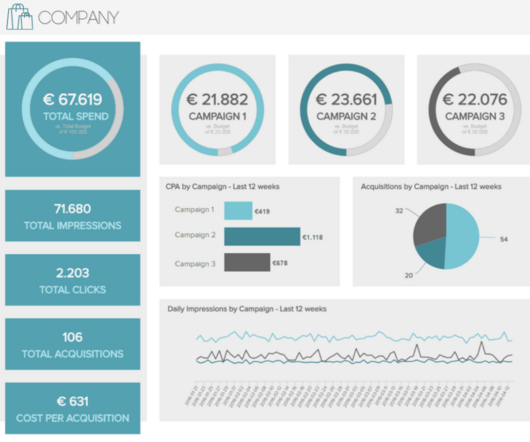
Now that you’re sold on the power of data analytics in addition to data-driven BI, it’s time to take your journey a step further by exploring how to effectively communicate vital metrics and insights in a concise, inspiring, and accessible format through the power of visualization. Data visualization: What You Need To Know.

article thumbnail

13 Essential Data Visualization Techniques, Concepts & Methods To Improve Your Business – Fast

Data Pine

“By visualizing information, we turn it into a landscape that you can explore with your eyes. 90% of the information transmitted to the brain is visual. Concerning professional growth, development, and evolution, using data-driven insights to formulate actionable strategies and implement valuable initiatives is essential.

Insiders

Sign Up for our Newsletter

This site is protected by reCAPTCHA and the Google Privacy Policy and Terms of Service apply.

article thumbnail

A Guide to the Best Javascript Visualization Libraries

Sisense

JavaScript data visualization tools are in greater demand now than ever before because of the enormous growth of data. Marketing , finance , and sales teams all rely on visualizations to help them understand their data. Understanding Javascript data visualization libraries.

article thumbnail

How to Visualize Your Music Data

Tableau

You don’t have to wait for your music streaming service to provide that for you anymore—you can see and learn from your listening data at any point in the year using Tableau. Whether this is your first Tableau visualization or your 100th, let this be a chance to practice and grow your viz-building skills using your own personal data!

article thumbnail

Smarten Announces Free Online Citizen Data Scientist Course Available to All!

ElegantJ BI

It is also suitable for those that wish to find out more about the Citizen Data Scientist approach to Data Literacy and fact-based decision-making. It provides an individual study environment that includes video, slides, lectures and supporting documentation for further study and reference.