
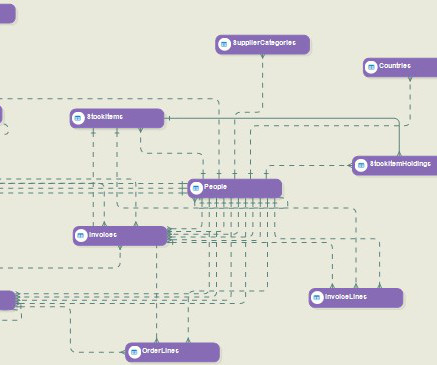
Designing and Deploying an OLTP Data Model with Ease
Astera
MARCH 20, 2023
As data warehousing technologies continue to grow in demand , creat ing effective data models has become increasingly important. However, creating an OLTP data model presents various challenges. Well, there’s a hard way of designing and maintaining data models and then there is the Astera’s way.


Let's personalize your content