

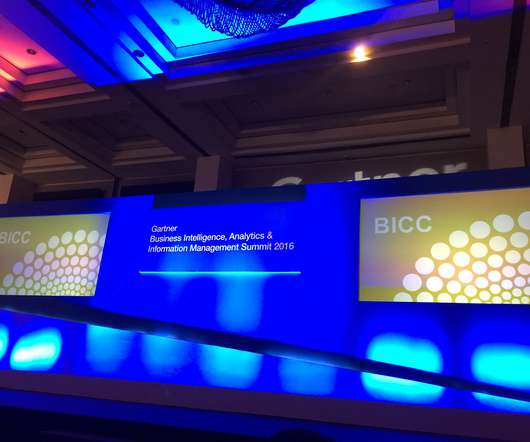
Gartner BI & Analytics Summit 2016: My Take
ElegantJ BI
JUNE 15, 2016
ElegantJ BI was listed as a representative vendor in the Gartner ‘Market Guide for Enterprise-Reporting-Based Platforms ‘, published in February 2016. Original Source – Gartner BI & Analytics Summit 2016: My Take The ElegantJ BI booth was REALLY BUSY.


Let's personalize your content