

Visualize Business Success with Smart Data Visualization
ElegantJ BI
JANUARY 6, 2017
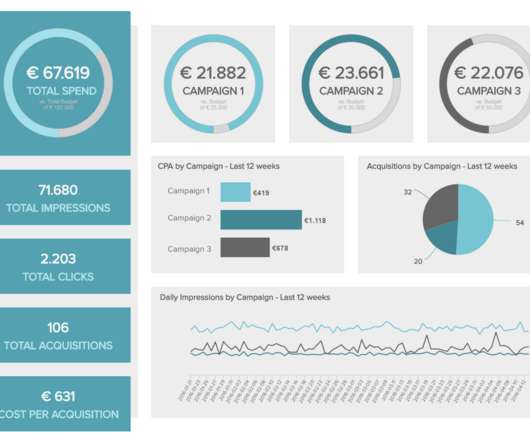
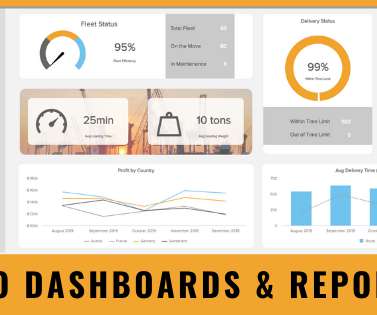
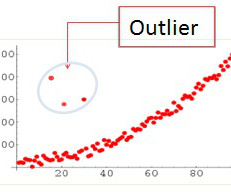
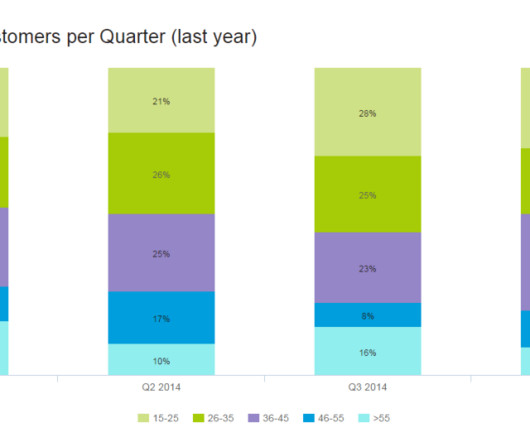
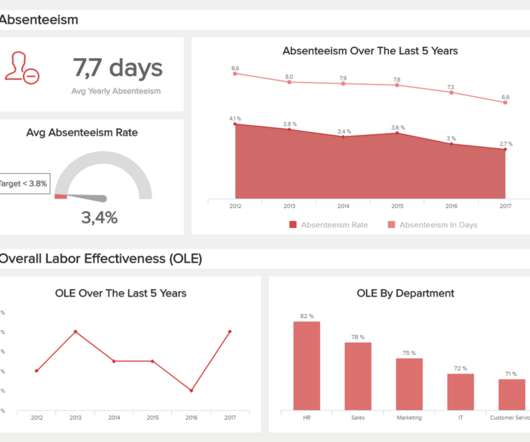
When you look at data, integrated from multiple sources, you aren’t trying to ‘visualize’ success and hope for the best. You are using visualization to ACHIEVE SUCCESS. Smart Data Visualization can help you to see patterns, trends, problems and opportunities and use that information to accomplish your goals.


Let's personalize your content