article thumbnail

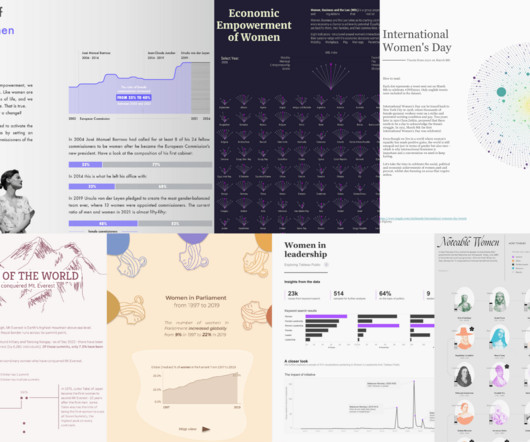
Visualizing Women's Impact to History Through Data Visualization

Tableau

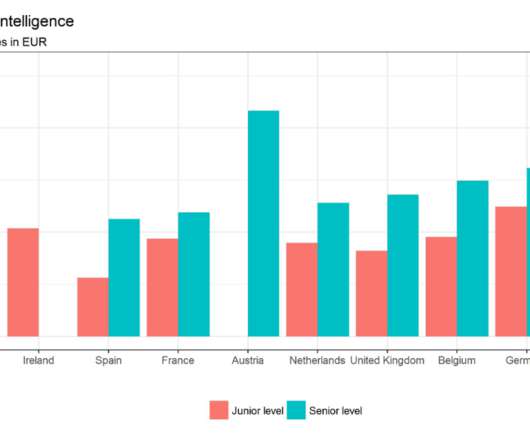
In the age of data-driven insights, it's fitting to explore how data visualization can be a powerful tool in telling the stories of women's achievements, struggles, and progress. You could also visualize social issues that impact women such as the gender pay gap, healthcare, or female representation in politics."

article thumbnail

Addressing the importance of data and visualization skills in health and healthcare fields

Tableau

Senior Data Skills Curriculum Strategy Manager, Tableau. According to the National Institutes of Health (NIH), “Data visualization is becoming an increasingly common method of presenting large and complex data sets, but the principles of visual communication are not widely understood or practiced.” Bronwen Boyd.

Insiders

Sign Up for our Newsletter

This site is protected by reCAPTCHA and the Google Privacy Policy and Terms of Service apply.

article thumbnail

Addressing the importance of data and visualization skills in health and healthcare fields

Tableau

Senior Data Skills Curriculum Strategy Manager, Tableau. According to the National Institutes of Health (NIH), “Data visualization is becoming an increasingly common method of presenting large and complex data sets, but the principles of visual communication are not widely understood or practiced.” Bronwen Boyd.

article thumbnail

What, Why, and How of Data Visualization

The BAWorld

Data Visualization. Did you know visualization has been in use since (and well before that as well) 1824 AD to develop an Egyptian map – the Turin Papyrus Map. Every data set tells us some story, but we need practical tools to find and communicate the story’s purpose with the stakeholders.

article thumbnail

How To Improve Your Facility Management With Healthcare Reports

Data Pine

Healthcare is one of the world’s most essential sectors. As a result of increasing demand in certain branches of healthcare, driving down unnecessary expenditure while enhancing overall productivity is vital. We’ve delved into the impact of big data in healthcare. What Is Healthcare Reporting?

article thumbnail

What Is Data Visualization and Why It Is Important?

The BAWorld

Data visualization is an essential step in the analytics life cycle. Before we dive into the topic, let us check the sales and profit data in different regions for various products. When we look at visuals, it holds our attention longer, and we process much more information than raw text. How To Create Good Charts?

article thumbnail

Why do Business Analysts need to learn Data visualization skills?

The BAWorld

But why Data visualization? In this article, I am going to examine Why do Business Analysts need to learn Data visualization skills? This report suggests that, in 2020, the job requirements for data science and analytics is projected to boom to by 364,000 openings to 2,720,000. They need to learn various skills.