Remove Article Remove Monitoring Remove Planning Remove Visualization
article thumbnail

Gantt charts for event planning to visualize success

Monday

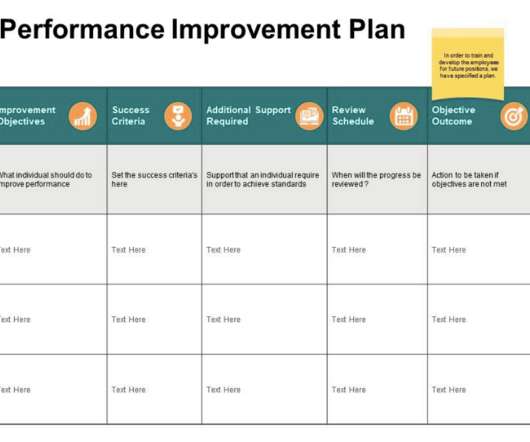
Using Gantt charts for event planning provides a consistent approach to defining events and working toward success with your team members — no matter how different each event actually is. In this article, you’ll learn about some core elements for successful event planning and how a Gantt chart can help you visualize and manage them.

article thumbnail

Work the Plan: Achieve Enterprise Agility With Jira Align

Cprime

In the previous articles in this three-part series, we discussed facing the challenges standing in the way of Enterprise Agility , and planning for Enterprise Agility based on value. For the remainder of this article, we’ll break down how Jira Align achieves this level of enterprise-wide visibility.

Insiders

Sign Up for our Newsletter

This site is protected by reCAPTCHA and the Google Privacy Policy and Terms of Service apply.

article thumbnail

A free corrective action plan template

Monday

Enter the corrective action plan — a flexible system for identifying and resolving business problems. In this article, we’ll dive into what a corrective action plan is, plus why and how to use one. We’ll also share a free corrective action plan template you can download and start using today. CTA to get your template*.

article thumbnail

DevOps Implementation Plan: A Comprehensive 6 Step Strategy

Cprime

The strategies in use to ensure a successful DevOps implementation plan. In this article, drawing on our experience in DevOps practices, we first define DevOps. And finally, we highlight the six strategies to a successful DevOps implementation plan. Monitor Application Performance. What Is DevOps?

article thumbnail

Tableau Metrics and Natural Language Query Evolve with Tableau Pulse

Tableau

We are truly excited about Tableau Pulse , launched in a wide beta in December 2023 and planned for general availability in Tableau 2024.1. Ask Data uses a keyword-based system to map user intent to analytical query and visualization. Identify which Metrics are currently in use in your environment: Set Up for Metrics Help article.

article thumbnail

Business Analysis Digest #35

Passionate BA

Welcome to the Business Analysis Digest #35, with the best business analysis and related topics articles of the previous weeks. Well, it could be your lucky day, as I share a great article about product discovery today! It highlights the power of combining data, narrative, and visualizations to communicate findings effectively.

article thumbnail

Choosing the Best Data Visualization Tool for Your Teams

Cprime

Excel is also not easy to interact with and it’s difficult to share its visualizations. Luckily, there are a wealth of data visualization tools available nowadays, including Tableau , Power BI , Qlik , Looker , and Google’s free Data Studio. What should you look for in a good data visualization tool?