article thumbnail

Work Management: Finding the best software to build and manage custom workflows

Monday

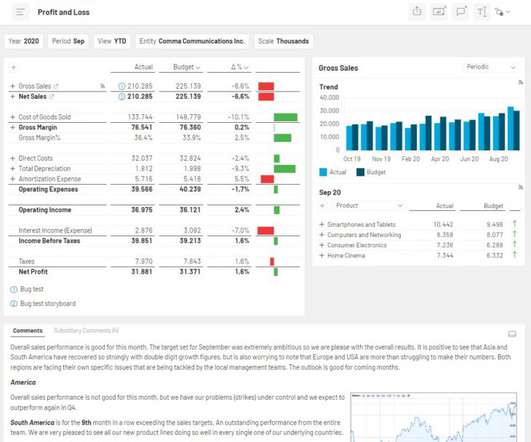
VISUAL DASHBOARDS: Customizable. Customizable dashboards and layout capabilities afford team members the flexibility to review data in a highly visual, easy-to-digest manner. Gantt charts are used for any organization that wants to manage its workflows in a visual and organized manner. Personalizable. million to $6.9

article thumbnail

Shared Data Reporting: Deep Excel Functionality Meets Web-Based Dashboards

Insight Software

Rich Visualizations Finance teams know the numbers in a report tell a story–but it’s much easier for non-technical viewers to understand when presented via visual elements. With Angles, you can: Convert raw data into rich visualizations and easily-accessible dashboards. Answer critical business questions quickly.

Insiders

Sign Up for our Newsletter

This site is protected by reCAPTCHA and the Google Privacy Policy and Terms of Service apply.

article thumbnail

Board Report Best Practices

Insight Software

Keeping your information clear and to the point by using plain language and enticing visuals can help you draft a report that both shines and communicates effectively. Use Visuals for Your KPIs. Board management software can be an ideal solution for gaining fantastic visuals easily that allow your information to shine.

article thumbnail

The Case for Embedded Analytics: How to Invest and Implement

Insight Software

Those who do it poorly are likely to flounder, perhaps wondering why their products are receiving a lukewarm reception from their primary audience. Analytics and data visualizations have the power to elevate a software product, such that it takes on a powerful new role in the lives of its users. Download Now. Access Resource.

article thumbnail

Your Path to a Stress-Free, Successful Year-End Close in Real Estate and Property Management?

Insight Software

Customize and consolidate financial reports across properties, entities, and currencies, ensuring compliance and providing comprehensive financial analysis and visualization tools. Shorter reporting cycles with less effort : Create charts, graphs, maps, and other visuals that combine data from multiple applications in just a few clicks.

article thumbnail

Growth and Achievement for insightsoftware’s Embedded Analytics

Insight Software

This was bolstered by insightsoftware’s acquisition of Dundas Data Visualization, Inc., adding deeper functionality that has strengthened Logi’s self-service data analytics and visualizations. 20-minute discovery call with a product expert. What to expect. Discover which solutions are best suited for your needs.

article thumbnail

4 Reasons Why You Should Upgrade to Hubble Enterprise

Insight Software

No way to add context to their data with web visualizations and metrics. Add Context to Your Data with Web Visualizations and Metrics Bring all your key metrics into focus in one place using easy-to-consume, real-time web dashboards to display beautiful visualizations.