Remove features dashboards
article thumbnail

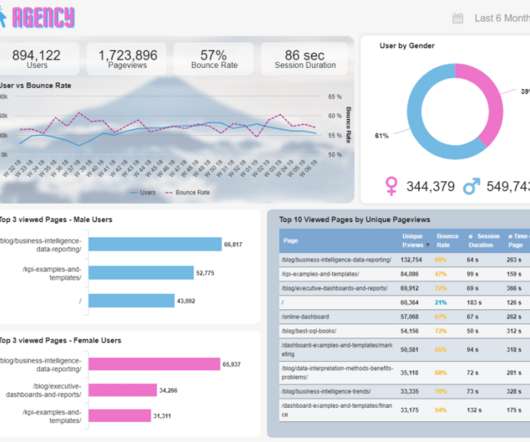
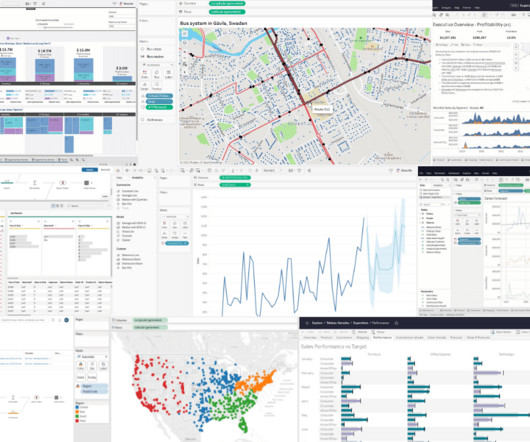
Uncover The Power Of White Label Dashboards & Reports With Key Features And Examples 

Data Pine

2) Benefits Of White Label Reports 3) Key White Label Reporting Features 4) White Label Dashboards & Report Examples In today’s competitive business environment, building a brand that is trusted, recognizable, and loved by many is not an easy task. Your Chance: Want to build your own white label reports & dashboards?

article thumbnail

Top Power BI Alternatives for Dynamic Data Visualization | Simplilearn

Simplilearn

However, a variety of products other than Power BI can be found in the market, offering features like data visualization. Data Visualization is designing enhanced dashboards customized accor. These user-friendly tools focus on being the alternatives to Power BI in mastering data visualization. Read More.

Insiders

Sign Up for our Newsletter

This site is protected by reCAPTCHA and the Google Privacy Policy and Terms of Service apply.

article thumbnail

Business Intelligence for Fairs, Congresses and Exhibitions

Smart Data Collective

Business intelligence tools can include data warehousing, data visualizations, dashboards, and reporting. Main features include the ability to access and operationalize data through the LookML library. It comes with embedded dashboards privately and publicly. You can connect Looker to other solutions through the Looker R SDK.

article thumbnail

Top BI and Analytics Tools for Data-Driven Businesses

Smart Data Collective

Features of Business Intelligence tools. Any ad hoc reporting tool may have a number of features to perform data analytics and these power packed features make the BI tool an attractive choice in the eyes of the data analysts’ team for a particular business. Creative Data dashboards. Easy to use Report designer.

article thumbnail

What is the Future of Business Intelligence in the Coming Year?

Smart Data Collective

Features: intuitive visualizations on-premise and cloud report sharing dashboard and report publishing to the web indicators of data patterns integration with third-party services (Salesforce, Google Analytics, Zendesk, Azure, Mailchimp, etc.). Unique feature: custom visualizations to fit your business needs better. QlickSense.

article thumbnail

Utilizing Data Analytics To Create Seamless Web Dashboards

Smart Data Collective

However, none of these features would be viable without web dashboards. We talked about the benefits of business dashboards before , but web dashboards have their own benefits. Big data and web dashboards go hand in hand. Big Data is Critical to Developing Web Dashboards. What is a web dashboard?

article thumbnail

How to Publish Power BI Reports: A Step-by-Step Process

Christian Steven

One of its key features, however, is the ability to work in real time. To do this, you must first learn how to publish Power BI reports and dashboards with your teams - and potentially the public. Power BI is an incredibly effective business intelligence tool that bridges the gap between data and decision-making.