article thumbnail

Fundamentals of Data Analytics

The BAWorld

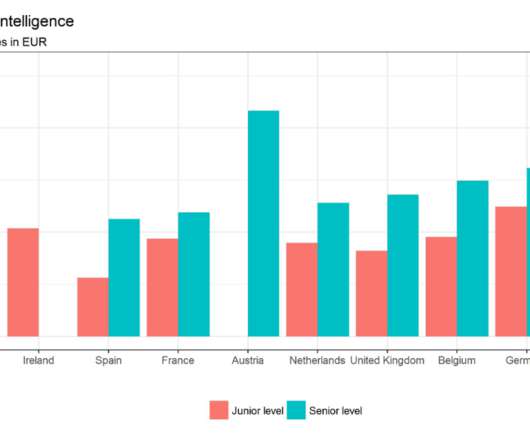
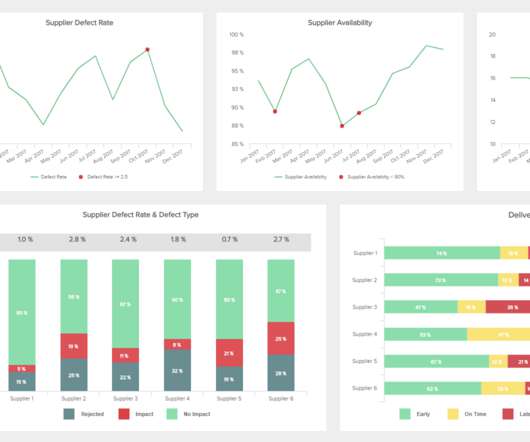
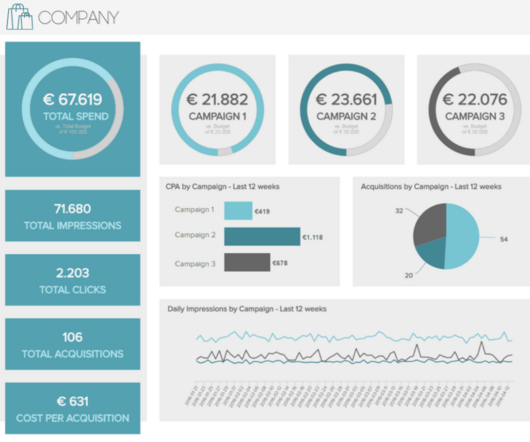
Examines several datasets to determine root causes: Examining various datasets to acquire a complete picture of what transpired is common in diagnostic analytics. A retailer, for example, can examine sales data, customer feedback, and marketing campaign data to determine why sales fell in a specific month.

article thumbnail

A Guide To Starting A Career In Business Intelligence & The BI Skills You Need

Data Pine

To simplify things, you can think of back-end BI skills as more technical in nature and related to building BI platforms, like online data visualization tools. Front-end analytical and business intelligence skills are geared more towards presenting and communicating data to others. b) If You’re Already In The Workforce.

Insiders

Sign Up for our Newsletter

This site is protected by reCAPTCHA and the Google Privacy Policy and Terms of Service apply.

article thumbnail

Obtain Business Development With Data Intelligence Tools & Technologies

Data Pine

Vision: Intelligence data analysis, if implemented wisely, can also offer an unrivaled predictive vision for today’s discerning business. A recent study suggests that the use of predictive analytics in business can result in an ROI of up to 25%. The retail sector is the very embodiment of supply and demand.

article thumbnail

An Introduction To Data Dashboards: Meaning, Definition & Industry Examples

Data Pine

To summarize, in the context of BI, data dashboards are used for: Deep-level insight: Drilling down deeper into key aspects of your business’s daily, weekly and monthly operation to create initiatives for increased efficiency. A data dashboard assists in 3 key business elements: strategy, planning, and analytics.

Logistics 126
article thumbnail

Introduction To The Basic Business Intelligence Concepts

Data Pine

The digestible patterns and information served up by online BI tools and solutions offer a viable means of predicting future outcomes and putting plans in place to either prevent calamities from occurring or take advantage of potential trends before your competitors. They enable powerful data visualization. click to enlarge**.

article thumbnail

Top Data Analytics Terms You Should Know

The BAWorld

Also, see data visualization. Data Analytics. Data analytics is the science of examining raw data to determine valuable insights and draw conclusions for creating better business outcomes. Data Visualization. For example, accurate data processing for ATMs or online banking.

article thumbnail

Utilize The Potential Of Digital Dashboards In A Business Environment

Data Pine

If you’re curious to present your data in a meaningful way, online data visualization is a powerful tool to do so indeed – data-driven dashboards offer a means of gaining access to vital information and delivering it throughout the organization with ease. Bubble plots. Number charts. Area charts. click to enlarge**.

Digital 75