Remove Data Visualization Remove Monitoring Remove Predictive Analytics Remove Retail
article thumbnail

An Introduction To Data Dashboards: Meaning, Definition & Industry Examples

Data Pine

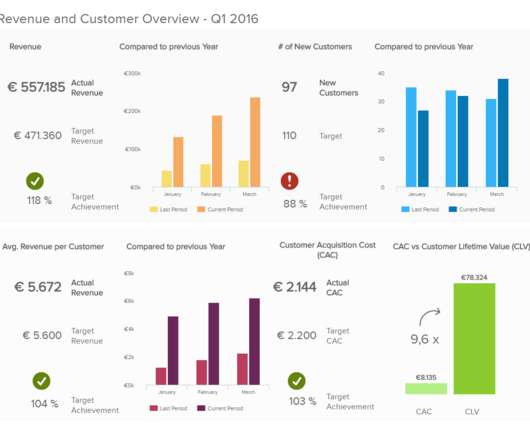
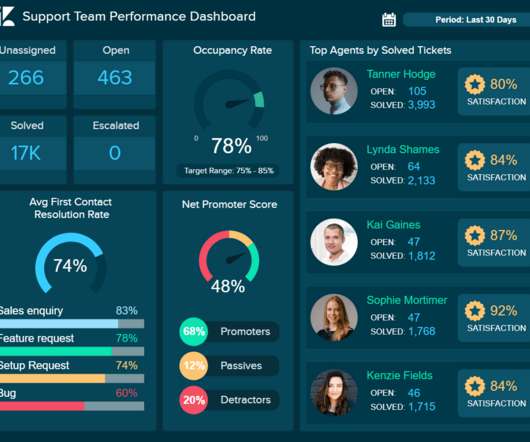
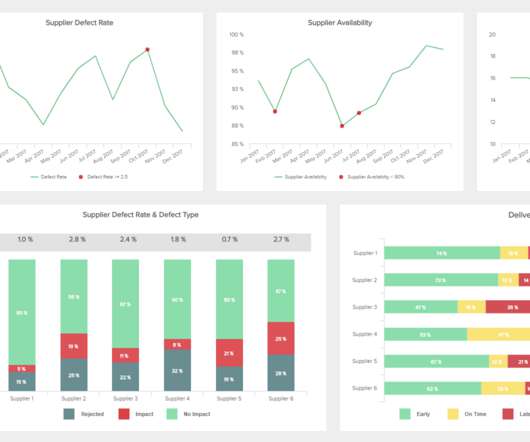
Learn all about data dashboards with our executive bite-sized summary! What Is A Data Dashboard? To summarize, in the context of BI, data dashboards are used for: Deep-level insight: Drilling down deeper into key aspects of your business’s daily, weekly and monthly operation to create initiatives for increased efficiency.

Logistics 126
article thumbnail

Introduction To The Basic Business Intelligence Concepts

Data Pine

The digestible patterns and information served up by online BI tools and solutions offer a viable means of predicting future outcomes and putting plans in place to either prevent calamities from occurring or take advantage of potential trends before your competitors. They enable powerful data visualization. click to enlarge**.

Insiders

Sign Up for our Newsletter

This site is protected by reCAPTCHA and the Google Privacy Policy and Terms of Service apply.

article thumbnail

A Guide To The Top 14 Types Of Reports With Examples Of When To Use Them

Data Pine

With this information in hand, businesses can build strategies based on analytical evidence and not simple intuition. With the use of the right BI reporting tool businesses can generate various types of analytical reports that include accurate forecasts via predictive analytics technologies.

article thumbnail

Utilize The Potential Of Digital Dashboards In A Business Environment

Data Pine

A digital dashboard is an electronic tracking tool used to build an interactive, visual representation of data from a host of sources including databases, CRM- and ERP data or other web services to monitor important business metrics and overall company’s performance. Bubble plots. Number charts. Area charts.

Digital 75
article thumbnail

Top 10 IT & Technology Buzzwords You Won’t Be Able To Avoid In 2020

Data Pine

An exemplary application of this trend would be Artificial Neural Networks (ANN) – the predictive analytics method of analyzing data. Some more examples of AI applications can be found in various domains: in 2020 we will experience more AI in combination with big data in healthcare. Connected Retail.

article thumbnail

How To Create Data Reports That Will Skyrocket Your Business Performance

Data Pine

Users can also easily export these dashboards and data visualizations into visually stunning reports that can be shared via multiple options such as automating e-mails or providing a secure viewer area, even embedding reports into your own application, for example. Be Visually Stunning. Also, keep it simple.

article thumbnail

What Is The Difference Between Business Intelligence And Analytics?

Data Pine

On the other hand, BA is concerned with more advanced applications such as predictive analytics and statistic modeling. This also allows the two terms to complement each other to provide a complete picture of the data. BI dashboards , offer the possibility to filter the data all in one screen to extract deeper conclusions.