article thumbnail

How to Bring Presentation Data to Life with Powered Template

Smart Data Collective

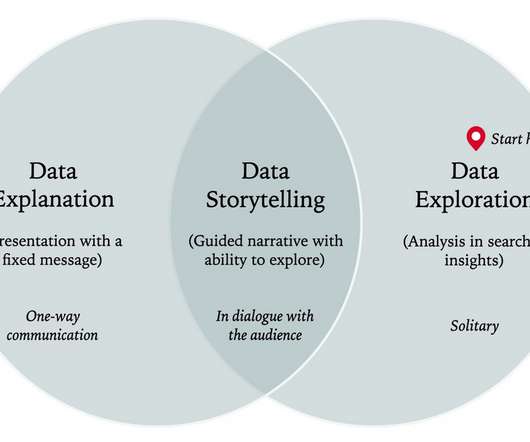
We have talked in the past about the importance of data visualization in business. One study by Robert Horn at Stanford found that 64% of participants made a decision immediately after watching a presentation with an overview map. However, many companies are struggling to figure out how to use data visualization effectively.

article thumbnail

From Raw Data to Visualization: Marvel Social Graph Analysis

Smart Data Collective

What’s amazing is that Marvel characters are developed through the influence of other Marvel heroes through data visualization. For instance, when Spider-Man appears in a comic book with Captain America, these are all visualized through data graphics. First Graphic Presentation. Then, together with sigma.js Shaping the Graph.

Insiders

Sign Up for our Newsletter

This site is protected by reCAPTCHA and the Google Privacy Policy and Terms of Service apply.

article thumbnail

How To Interact With Power BI Data In A PowerPoint Presentation

Smart Data Collective

Power BI proves to be the best tool for analysis and visualization of data. Microsoft Power BI is a Business Intelligence and Data Visualization tool which assists organizations to analyze data from multiple sources, convert it into an interactive dashboard and share insights. Copy-Paste Power BI Visuals in PowerPoint.

article thumbnail

How to Present Data to a Non-Technical Audience

Smart Data Collective

. When you’re presenting data analytics or any technical information to a non-technical audience, it can be difficult. You have to think about the components of a good presentation in general, but also how to simplify complex subjects and information and make them resonate with your target audience. Data Visualization.

article thumbnail

A Practical Guide to Business Intelligence Governance

Speaker: Marius Moscovici, CEO Metric Insights & Mike Smitheman, VP Metric Insights

To be effective, Business Intelligence (BI) governance must cover both data and visualizations. This presentation will provide a practical step-by-step guide for implementing effective BI governance and a toolkit for addressing the three critical aspects of any program: People - Roles and responsibility in the governance process.

article thumbnail

DirectX Visualization Optimizes Analytics Algorithmic Traders

Smart Data Collective

Learn how DirectX visualization can improve your study and assessment of different trading instruments for maximum productivity and profitability. Let’s dive right into how DirectX visualization can boost analytics and facilitate testing for you as an Algo-trader, quant fund manager, etc. But first, What is DirectX Anyway?

article thumbnail

Extend Your Visual Analytics with Tableau Viz Extensions

Tableau

This feature was inspired by the New Chart Type Pilot on Tableau Public in spring 2023, where we saw excitement from our DataFam in how new visualizations were introduced. Viz Extensions allow us to load more visualization types onto the Tableau worksheet Marks card, extending Tableau’s rich visualization foundation at will.