article thumbnail

Mastering Business Intelligence: Comprehensive Guide to Concepts, Components, Techniques, and…

Analysts Corner

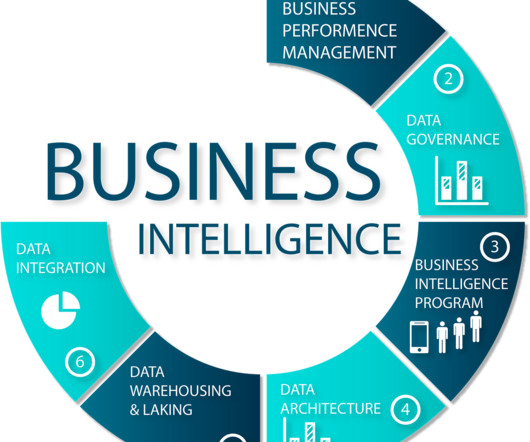
Business Intelligence (BI) plays a crucial role in this process, enabling organizations to transform raw data into actionable insights and informed strategies. Data Presentation: The final component of BI is the presentation of the analyzed data in a format that is easy to understand and actionable.

article thumbnail

Analyst’s corner digest #18

Analysts Corner

> Keep reading… Enterprise Architecture and Agile 1) How to Practise Enterprise Architecture by Shashi Sastry The advantages of thinking, planning, and systematic work are well known, whether baking a cake or going to Mars. Yet while many methodologies have come and gone over the years, two have taken centre stage: agile and scrum. . >

Insiders

Sign Up for our Newsletter

This site is protected by reCAPTCHA and the Google Privacy Policy and Terms of Service apply.

article thumbnail

The Product Strategy Cycle

Roman Pichler

For example, a product manager might determine the product strategy and one or more development teams might be tasked with executing it. But as long as innovation, change, and risk are present, this approach is ineffective. Based on this insight, I have come up with the product strategy cycle shown in the picture below.

article thumbnail

Uncover The Power Of White Label Dashboards & Reports With Key Features And Examples 

Data Pine

On the other side, regular businesses use white label dashboard software to generate their reports as a way to present a professional image to external stakeholders such as investors or to keep a cohesive image and brand identity with employees. These analysis tools are not only customized in appearance but also in functionality.

article thumbnail

Understanding Data Drill Down And Drill Through Analysis And Their Role In Efficient Reporting

Data Pine

And not just that, by presenting one dimension of data at a time, drill through and drill down reporting features lighten the data load making the reporting process more efficient for the end-user. Drilling on data enables you to look at your most relevant information and visualize it from different points of view. Total revenue.

article thumbnail

A Guide To The Methods, Benefits & Problems of The Interpretation of Data

Data Pine

Yet, before any serious data interpretation inquiry can begin, it should be understood that visual presentations of data findings are irrelevant unless a sound decision is made regarding scales of measurement. The interpretation of data is designed to help people make sense of numerical data that has been collected, analyzed, and presented.

article thumbnail

What do data-driven companies have in common? Research reveals five key trends

Tableau

Data-leading companies were 3x more likely than data-aware organizations to require new hires to know how to persuasively present data.”. Building management giant Jones Lang LaSalle (JLL) saw the strategic balancing act needed to create an effective training plan that evolved behaviors, mindsets, and skills around data.