Remove Design Thinking Remove Digital Remove Documentation Remove Visualization
article thumbnail

Unleashing the Power of Visual Thinking – Interview with Grant Wright

Business Bullet

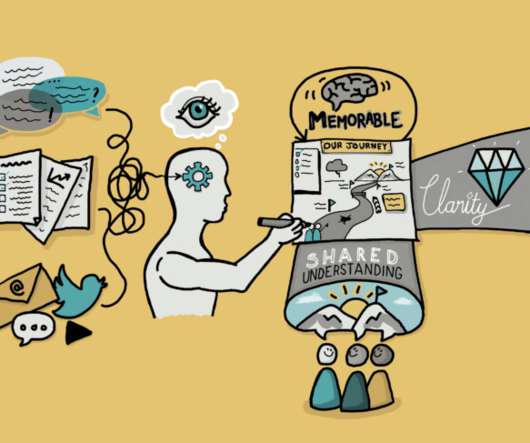
Grant Wright facilitated a half day workshop at the European Business Analysis conference 2020 on Unleashing the power of visual thinking. Grant actively practices Visual Thinking throughout his work and is passionate about its ability to create alignment, improve understanding and generate creative ideas.

article thumbnail

Mastering Product Management: A Comprehensive Guide for Success

Argon Digital

By visualizing and eliminating non-value-added activities, product managers can optimize processes and reduce waste. User Experience (UX) and Design Thinking User experience (UX) is a critical factor in the success of any product. Learn how to integrate design thinking principles into your product management process.

Insiders

Sign Up for our Newsletter

This site is protected by reCAPTCHA and the Google Privacy Policy and Terms of Service apply.

article thumbnail

How to get stakeholder buy-in for user research: 31 expert tips

Userzoom

Much like UX design itself, there’s no one size fits all strategy, so you need to tailor your approach to both the audience and the problem at hand. So the best advice would be to use your design thinking and storytelling abilities to communicate the right message to the right people.” UX Researcher / Designer.

article thumbnail

150+ Top Global Cloud Thought Leaders and Next Generation Leaders of 2021

Whizlabs

It is loud and clear that Cloud Computing is fundamental to the new wave of digital transformation. Lori’s must read blogs are The Third Wave of Cloud is Cresting , The Fourth Wave of Cloud is Imminent and Will the Emerging Edge Fix My Digital Gaming Experience? Follow Lori MacVittie on Twitter , LinkedIn , and Blog/Website.

article thumbnail

Discover 20 Essential Types Of Graphs And Charts And When To Use Them

Data Pine

That said, there is still a lack of charting literacy due to the wide range of visuals available to us and the misuse of statistics. In many cases, even the chart designers are not picking the right visuals to convey the information in the correct way. Let’s dive into them.