Remove Data Visualization Remove Planning Remove Real-time Data Remove Retail
article thumbnail

Fundamentals of Data Analytics

The BAWorld

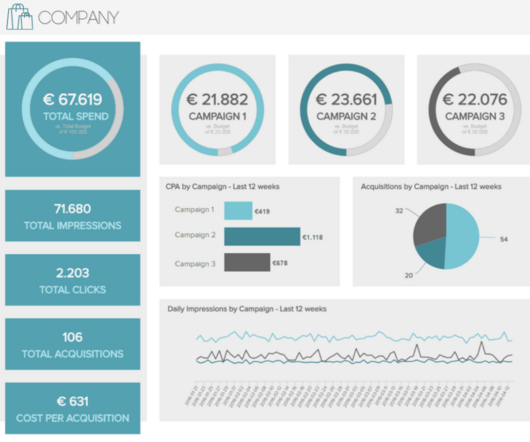
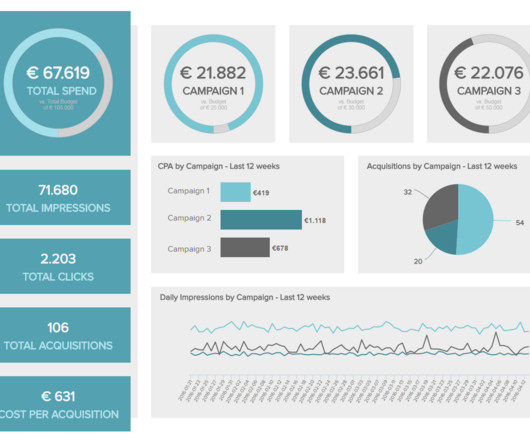
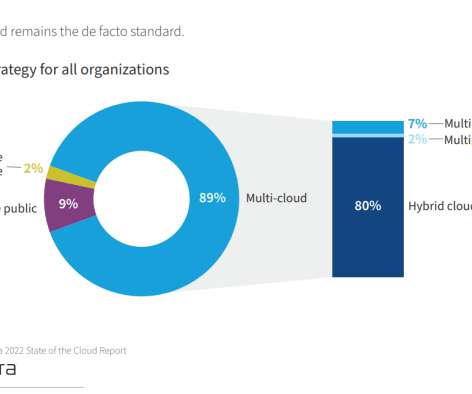
A retailer, for example, can examine sales data, customer feedback, and marketing campaign data to determine why sales fell in a specific month. Tableau: Description: Advanced data visualization software for interactive and intuitive insights. Key Features: Seamless integration with various data sources.

article thumbnail

An Introduction To Data Dashboards: Meaning, Definition & Industry Examples

Data Pine

To summarize, in the context of BI, data dashboards are used for: Deep-level insight: Drilling down deeper into key aspects of your business’s daily, weekly and monthly operation to create initiatives for increased efficiency. A data dashboard assists in 3 key business elements: strategy, planning, and analytics.

Logistics 126
Insiders

Sign Up for our Newsletter

This site is protected by reCAPTCHA and the Google Privacy Policy and Terms of Service apply.

article thumbnail

Master Your Analytics Challenges With Professional Embedded BI Tools

Data Pine

Having access to personalized real-time data helps organizations stay on top of any developments and find improvement opportunities to boost their performance. In time, this will skyrocket growth which will significantly set your company apart from competitors at the same time.

article thumbnail

What Are Business Reports And Why They Are Important: Examples & Templates

Data Pine

They may gather financial, marketing and sales-related information, or more technical data; a business report sample will be your all-time assistance to adjust purchasing plans, staffing schedules, and more generally, communicating your ideas in the business environment. Visual investors business report example.

Retail 119
article thumbnail

Make Sure You Know The Difference Between Strategic, Analytical, Operational And Tactical Dashboards

Data Pine

Cloud-based, real-time online data visualization software enables fast, data-driven action by decision-makers. Digital age needs digital data. Before you run off to the dashboard printing presses, we mean data visualization software, let’s talk about using the right ways to build and use dashboards.

article thumbnail

28 Sales Reports Examples You Can Use For Daily, Weekly or Monthly Reports

Data Pine

Your friend excitedly tells you their plan, and all of the actions they plan to take to achieve their goal. Visualize and communicate your findings : the most important part, once you have analyzed and dug out insights from your data, is to convey this information to your audience. Don’t forget the executive summary.

Retail 105
article thumbnail

Dashboard Storytelling: From A Powerful To An Unforgettable Presentation

Data Pine

This statement is as true today as it was in ancient Greece – perhaps even more so in modern times. Moreover, we will offer dashboard storytelling tips and tricks that will help you make your data-driven narrative-building efforts as potent as possible, driving your business into exciting new dimensions. Big data commands big stories.