Remove Data Visualization Remove Monitoring Remove Procurement Remove Retail
article thumbnail

A Beginner’s Guide To Inventory Metrics And Best Practices

Data Pine

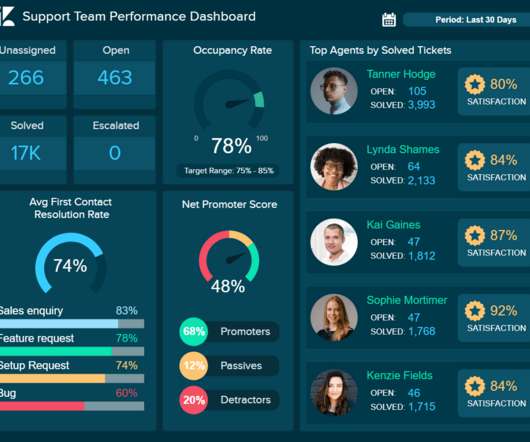
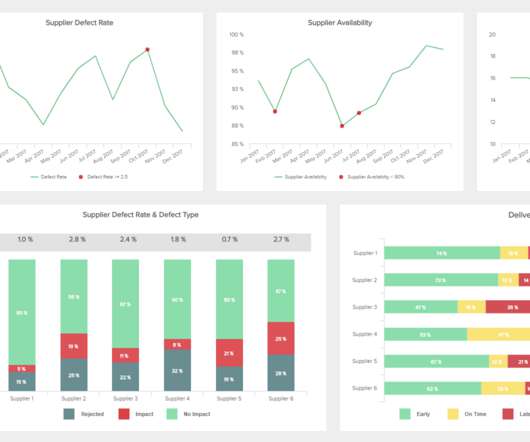
Your Chance: Want to visualize & track inventory KPIs with ease? Inventory metrics are indicators that help you monitor, measure, and assess your performance – and thus, give you some keys to optimize your processes as well as improve them. In this case, the point is to monitor this rate and identify when and what is missing.

article thumbnail

Introduction To The Basic Business Intelligence Concepts

Data Pine

They enable powerful data visualization. If you’re able to visualize your data with the help of online data visualization , making it digestible to the human eye, you’ll be able to tell a story with your insights and communicate your discoveries to others more effectively. click to enlarge**.

Insiders

Sign Up for our Newsletter

This site is protected by reCAPTCHA and the Google Privacy Policy and Terms of Service apply.

article thumbnail

A Complete Guide On How To Set Smart KPI Targets And Goals

Data Pine

In a world where data represents a major competitive advantage for businesses, the need to monitor performance based on specific goals and targets is critical. It is not enough to track relevant customer or sales data. Your Chance: Want to monitor your KPI targets & goals with ease? 2) What Are KPI Targets.

article thumbnail

Take Advantage Of Modern CEO Dashboards – Examples And Templates

Data Pine

A CEO dashboard is an interactive platform that visualizes data to empower business leaders to track, measure, analyze, and monitor business performance in a number of areas, enabling them to make data-driven decisions and see the big business picture. Let’s get started. What Is A CEO Dashboard?

article thumbnail

KPI Management And Best Practices: How To Find The Perfect KPI Solutions?

Data Pine

KPI management is the process of selecting, monitoring, and analyzing specific industry key performance indicators (or KPIs). Think of your business goals Many industries use KPI management solutions to isolate their strongest indicators, such as in the field of retail analytics. But first, let’s start with a simple definition.

article thumbnail

A Guide To The Top 14 Types Of Reports With Examples Of When To Use Them

Data Pine

Operational reports are commonly used in manufacturing, logistics, and retail as they help keep track of inventory, production, and costs, among others. Product Reports As its name suggests, this report type is used to monitor several aspects related to product performance and development. One of them being investor relationships.

article thumbnail

Utilize The Potential Of Digital Dashboards In A Business Environment

Data Pine

A digital dashboard is an electronic tracking tool used to build an interactive, visual representation of data from a host of sources including databases, CRM- and ERP data or other web services to monitor important business metrics and overall company’s performance. Bubble plots. Number charts. Area charts.

Digital 75