
BI Tools Provide Benefits and Challenges!
ElegantJ BI
AUGUST 3, 2022
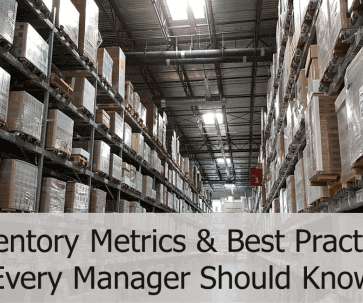
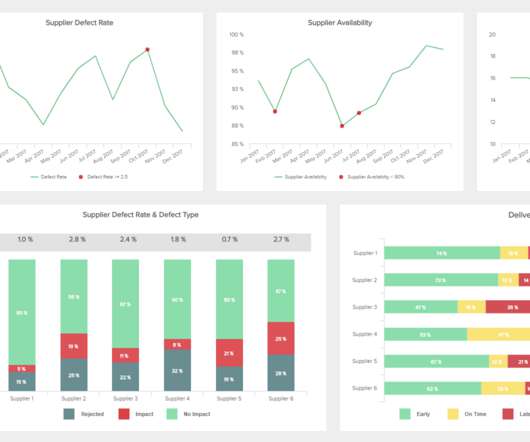
Interactive Dashboards track item movement, compare sales to closing stock, and monitor warehouse stock and value, and answer critical questions regarding stock turnover ratio, seasonal buying, back-order assessment and safety stock to prevent lost sales.


Let's personalize your content