article thumbnail

Why Do You Need To Visualize Your Accounting Reports?

Data Pine

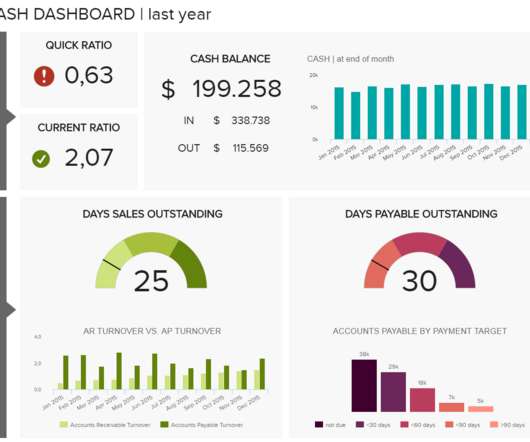
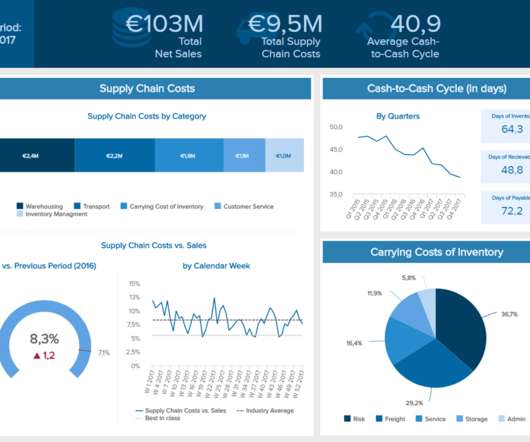
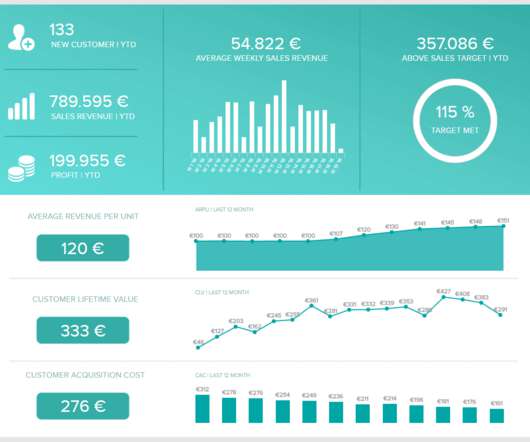
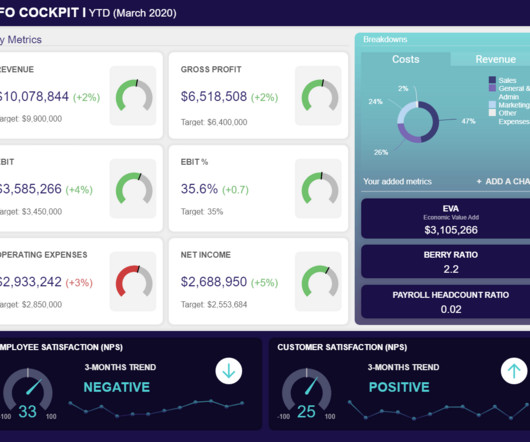
The more accurate the records, the better the financial analysis or projection. In general, a well-implemented accounting reporting system makes it easier to access the financial statements you need, whenever you need them. This accounting report sample will monitor what goes in and out of your treasury.

article thumbnail

15 Examples Of Financial Graphs And Charts You Can Use For Your Business

Data Pine

The financial health, flow, and fluidity of your business will ultimately dictate its long-term success, which is why monitoring your money matters carefully, comprehensively, and accurately is absolutely essential. Online data visualization is taking precedence in business operations, creating more efficient and faster workspaces.

Insiders

Sign Up for our Newsletter

This site is protected by reCAPTCHA and the Google Privacy Policy and Terms of Service apply.

article thumbnail

15 Supply Chain Metrics & KPIs You Need For A Successful Business

Data Pine

That’s why it’s critical to monitor and optimize relevant supply chain metrics. You can even include supply delivery metrics in your performance dashboard focused on the supply chain, and monitor it more closely. Please, see the bottom of this article to take a closer look at a supply chain KPI dashboard. Return Reason.

article thumbnail

What Are Business Reports And Why They Are Important: Examples & Templates

Data Pine

This is where the need to use a report tool and monitor when all of these little and big changes arise: knowing what is happening in your business is key to keep it afloat and be prepared to face any transformation or drastic shift. All your financial analysis can be integrated into a single visual.

Retail 119
article thumbnail

10 Ways That Corporate Dashboards Can Make Your Enterprise Life Easier

Data Pine

Corporate (or enterprise) dashboards are dynamic digital and visual tools that offer a comprehensive working insight into a wide range of corporate or company’s metrics and data, focused on monitoring, optimization, and achievement of strategic goals. Switching between different data sources and tools to create charts.

article thumbnail

What Is Ad Hoc Reporting? Your Guide To Definition, Meaning, Examples & Benefits

Data Pine

Moreover, a host of ad hoc analysis or reporting platforms boast integrated online data visualization tools to help enhance the data exploration process. This reduces the reliance on software developers or IT personnel for simple analysis and reporting. Data visualization capabilities.

Retail 104