

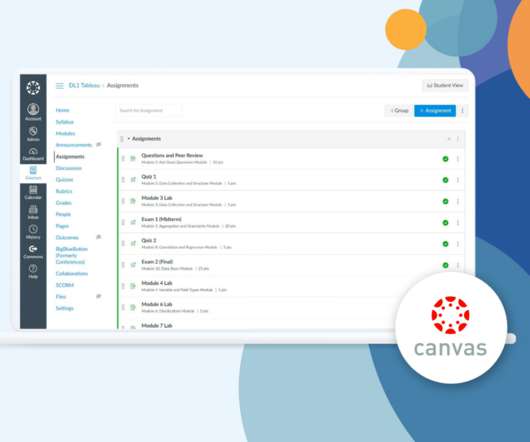
Introducing Tableau data literacy curriculum for the Canvas learning management system
Tableau
SEPTEMBER 2, 2021
September 2, 2021 - 1:50pm. September 2, 2021. I’m proud to announce that our ready-made Data Literacy One curriculum is now available in Canvas learning management system (LMS) format. Instructors can spend hours uploading documents, copy-pasting test questions and answers, and organizing modules in their LMS.


Let's personalize your content