
Best of the Tableau Web: June 2021
Tableau
JUNE 26, 2021
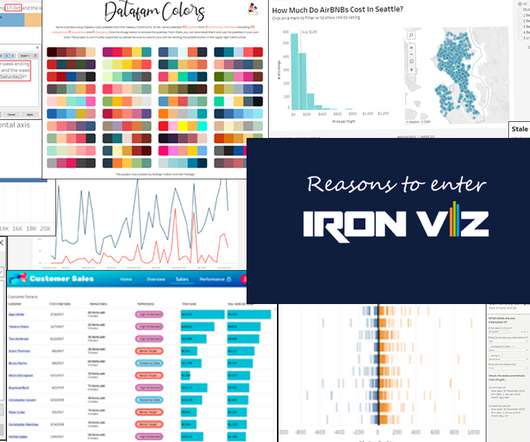
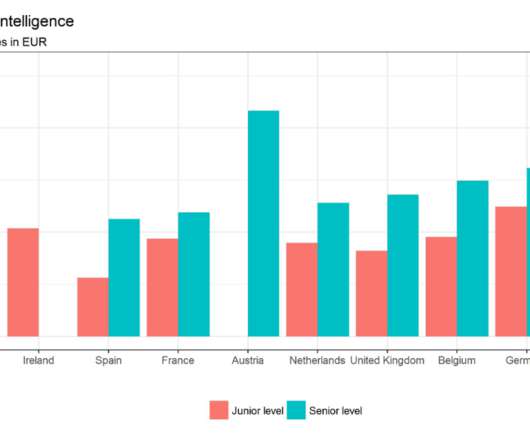
June 26, 2021 - 2:29pm. June 26, 2021. Sarah Bartlett, Sarah Loves Data : Reasons to Enter Iron Viz 2021. Heidi Kalbe, Queen Of Data : Five ways of labelling above your horizontal axis in Tableau. Joselito Bondoc, The Data School : Using Custom Admin Views to Help with Tableau Server Housekeeping.


Let's personalize your content