
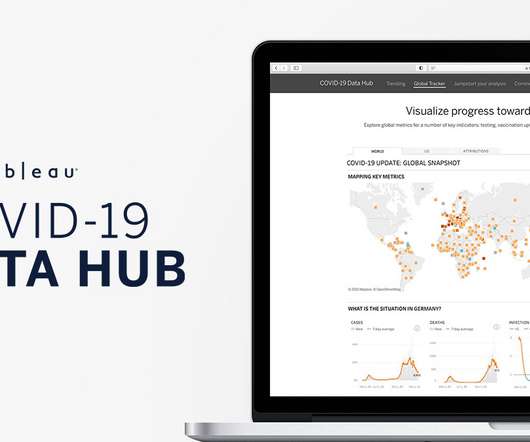
New COVID-19 Global Tracker measures progress toward recovery
Tableau
MARCH 2, 2021
Our new Global Tracker pulls information from multiple data sources into one visualization, updated daily, allowing people to see and interact with those data to inform individual behavior, business decisions, and government policy. . . Different data sources, one data visualization: the power of Prep Builder.


Let's personalize your content