Remove Monitoring Remove Predictive Analytics Remove Procurement Remove Retail
article thumbnail

Introduction To The Basic Business Intelligence Concepts

Data Pine

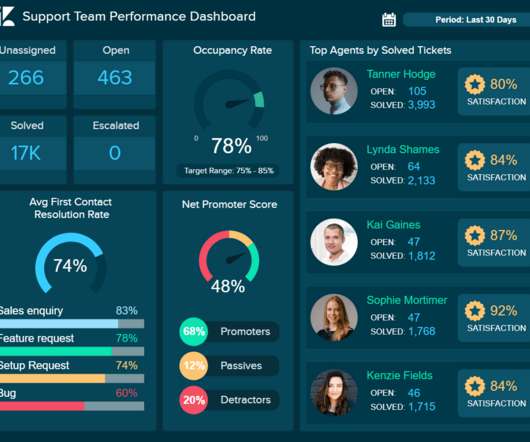
Building on our previous point, the fourth and perhaps most pivotal component of an interactive dashboard is the ability to continuously track, monitor, and report your data. For instance, a retail store dashboard like the one above will greatly help the manager in knowing his/her customers’ behavior. click to enlarge**.

article thumbnail

A Guide To The Top 14 Types Of Reports With Examples Of When To Use Them

Data Pine

With this information in hand, businesses can build strategies based on analytical evidence and not simple intuition. With the use of the right BI reporting tool businesses can generate various types of analytical reports that include accurate forecasts via predictive analytics technologies.

Insiders

Sign Up for our Newsletter

This site is protected by reCAPTCHA and the Google Privacy Policy and Terms of Service apply.

article thumbnail

What Is The Difference Between Business Intelligence And Analytics?

Data Pine

On the other hand, BA is concerned with more advanced applications such as predictive analytics and statistic modeling. By using Business Intelligence and Analytics (ABI) tools, companies can extract the full potential out of their analytical efforts and make improved decisions based on facts.

article thumbnail

Utilize The Potential Of Digital Dashboards In A Business Environment

Data Pine

A digital dashboard is an electronic tracking tool used to build an interactive, visual representation of data from a host of sources including databases, CRM- and ERP data or other web services to monitor important business metrics and overall company’s performance. Investor Relations Dashboard. click to enlarge**. click to enlarge**.

Digital 75