Remove IBM Expert Remove Planning Remove Vision Remove Visualization
article thumbnail

Go Beyond Data Visualization to Data Storytelling

Insight Software

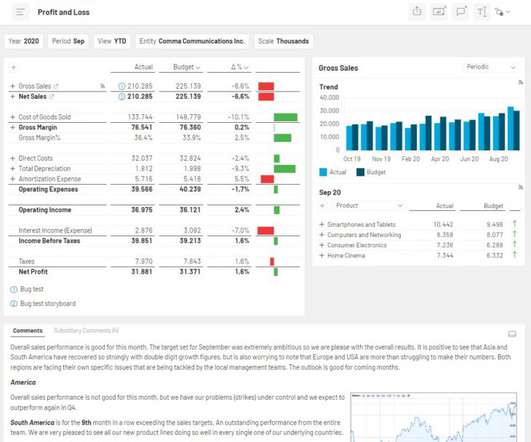
Raw Data, Visualizations, and Data Storytelling. Imagine the following three scenarios, all based around the same core set of information: Bill compiles a set of historical sales figures spanning the past two years, summarizes it by month, and provides breakdowns for each of the three product lines that the company sells.

article thumbnail

Tax Reports Not Making Cents? Visualizations Are Your Friend

Insight Software

By integrating a tax system , like Longview, with your existing enterprise resource planning tool (ERP) you can significantly decrease tax reporting time by automating data collection and aggregation. Step 2: Communicate Your Tax Analyses More Effectively with Dashboards and Visualizations. Access Resource. Access Resource.

Insiders

Sign Up for our Newsletter

This site is protected by reCAPTCHA and the Google Privacy Policy and Terms of Service apply.

article thumbnail

Excel Flexibility, Streamlined Workflows: Meet Power ON Budget Planner

Insight Software

The 3 Biggest Budget Stumbling Blocks Effective planning, budgeting, and forecasting is a critical exercise that sets the foundation for the month or year ahead and requires careful consideration and prioritization. The tool also allows users to visualize budgeting data, bringing clarity and insight to often-complex numbers.

article thumbnail

Learning Qlik Sense: Top Tips for Getting Started with Qlik

Insight Software

YouTube, in particular, is an excellent source of how-to videos for Qlik, with popular users posting content about everything from Qlik Sense basics to advanced data visualization. Qlik users have an active online presence, and it’s easy to find blogs and video tutorials with a basic internet search.

article thumbnail

Save Time and Stress with Dynamics Data Merging from Atlas

Insight Software

With Atlas, you can quickly and easily merge data to create custom reports in minutes without having to customize Dynamics AX or D365 F&SCM or rely on IT assistance. Get a Demo See how companies are getting live data from their ERP into Excel, and closing their books 4 days faster every month.

article thumbnail

Shared Data Reporting: Deep Excel Functionality Meets Web-Based Dashboards

Insight Software

Rich Visualizations Finance teams know the numbers in a report tell a story–but it’s much easier for non-technical viewers to understand when presented via visual elements. With Angles, you can: Convert raw data into rich visualizations and easily-accessible dashboards. Answer critical business questions quickly.

article thumbnail

Embracing the Tech Wave: Three Ways to Do More With Less With Your Tax Reporting

Insight Software

It’s not enough just to have a well-formatted report that anyone in the tax and finance areas can read and understand, you also need to deliver visual analytics that are digestible for stakeholders outside of finance. Use a tax solution that offers accelerated planning, consolidation, tax, and transfer pricing as well as analytics.