Remove Digital Remove Financial Analysis Remove Monitoring Remove Real-time Data
article thumbnail

15 Examples Of Financial Graphs And Charts You Can Use For Your Business

Data Pine

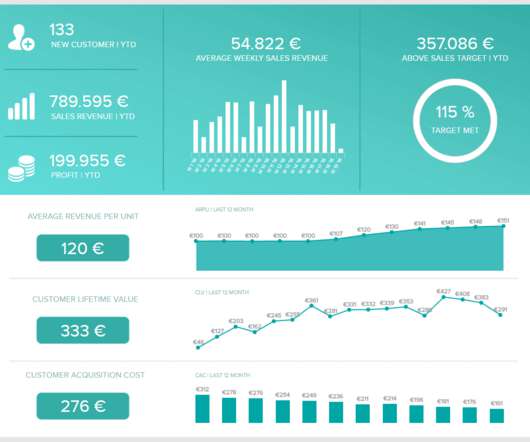
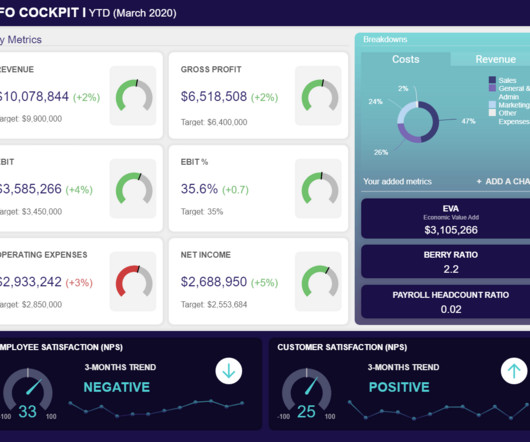
The financial health, flow, and fluidity of your business will ultimately dictate its long-term success, which is why monitoring your money matters carefully, comprehensively, and accurately is absolutely essential. That’s why financial charts and graphs need to be created with the utmost care and attention.

article thumbnail

What Are Business Reports And Why They Are Important: Examples & Templates

Data Pine

This is where the need to use a report tool and monitor when all of these little and big changes arise: knowing what is happening in your business is key to keep it afloat and be prepared to face any transformation or drastic shift. All your financial analysis can be integrated into a single visual.

Retail 119
Insiders

Sign Up for our Newsletter

This site is protected by reCAPTCHA and the Google Privacy Policy and Terms of Service apply.

article thumbnail

10 Ways That Corporate Dashboards Can Make Your Enterprise Life Easier

Data Pine

Corporate (or enterprise) dashboards are dynamic digital and visual tools that offer a comprehensive working insight into a wide range of corporate or company’s metrics and data, focused on monitoring, optimization, and achievement of strategic goals. The Future Of Data Presentation. What Is A Corporate Dashboard?

article thumbnail

What Is Ad Hoc Reporting? Your Guide To Definition, Meaning, Examples & Benefits

Data Pine

“The goal is to turn data into information, and information into insight.” – Carly Fiorina, former executive, president, HP. Digital data is all around us. quintillion bytes of data every single day, with 90% of the world’s digital insights generated in the last two years alone, according to Forbes.

Retail 104
article thumbnail

Your Path to a Stress-Free, Successful Year-End Close in Real Estate and Property Management?

Insight Software

Manual processes : The time-consuming and tedious process of copying/pasting data from MRI or Yardi standard reports and merging that with any other relevant data (possibly from other systems) for relevant reporting. Automate monitoring and management of loan-related impacts on cash flow and debt ratios.