Remove Data Visualization Remove Innovation Remove Procurement Remove Retail
article thumbnail

Introduction To The Basic Business Intelligence Concepts

Data Pine

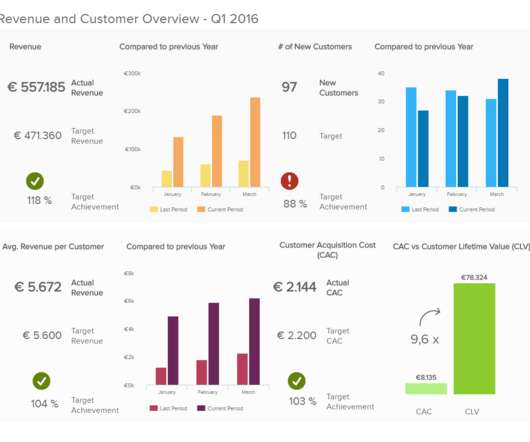
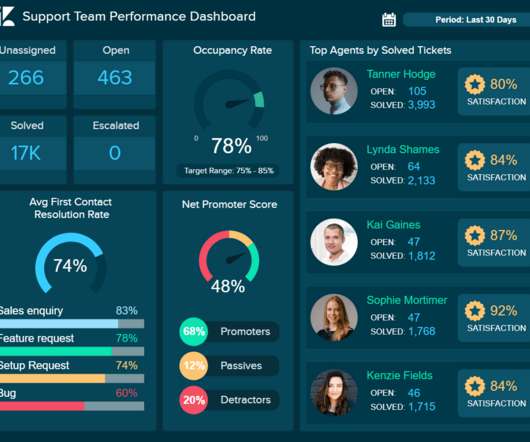
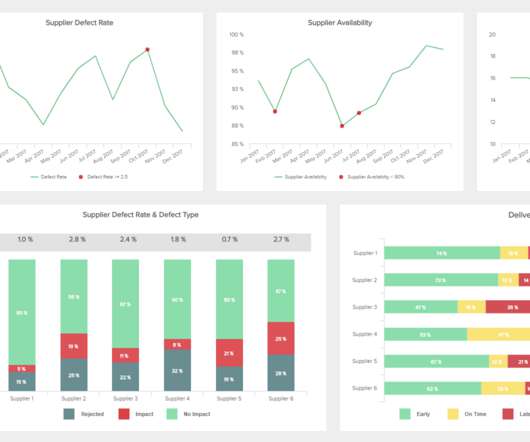
They enable powerful data visualization. If you’re able to visualize your data with the help of online data visualization , making it digestible to the human eye, you’ll be able to tell a story with your insights and communicate your discoveries to others more effectively. click to enlarge**.

article thumbnail

A Complete Guide On How To Set Smart KPI Targets And Goals

Data Pine

For example, if you own a retail business and want to improve your logistics processes, you can look into what successful companies in the logistics industry are doing and generate attainable objectives for yourself. The SUM is a metric that tracks the percentage of spending that is actively managed by the procurement manager.

Insiders

Sign Up for our Newsletter

This site is protected by reCAPTCHA and the Google Privacy Policy and Terms of Service apply.

article thumbnail

Take Advantage Of Modern CEO Dashboards – Examples And Templates

Data Pine

By leveraging smart online data analysis in the right way, you will gain access to insights that will help you develop strategies that foster growth and innovation while keeping your staff motivated, engaged, and happy. Other relevant areas might be customer support, HR, IT, procurement, etc.

article thumbnail

KPI Management And Best Practices: How To Find The Perfect KPI Solutions?

Data Pine

Think of your business goals Many industries use KPI management solutions to isolate their strongest indicators, such as in the field of retail analytics. That’s not to say these indicators are the only choices for retail businesses, but they do make a solid starting point. Retail: When will my customers spend more money?

article thumbnail

A Guide To The Top 14 Types Of Reports With Examples Of When To Use Them

Data Pine

Operational reports are commonly used in manufacturing, logistics, and retail as they help keep track of inventory, production, and costs, among others. Project Reports Projects are key to keeping a business moving in the right direction while keeping innovation and evolution at the forefront of every plan, communication, or campaign.

article thumbnail

Utilize The Potential Of Digital Dashboards In A Business Environment

Data Pine

If you’re curious to present your data in a meaningful way, online data visualization is a powerful tool to do so indeed – data-driven dashboards offer a means of gaining access to vital information and delivering it throughout the organization with ease. Bubble plots. Number charts. Area charts.

Digital 75
article thumbnail

14 Dashboard Design Principles & Best Practices To Enhance Your Data Analysis

Data Pine

The rise of innovative, interactive, data-driven dashboard tools has made creating effective dashboards – like the one featured above – swift, simple, and accessible to today’s forward-thinking businesses. We can’t stress enough the importance of choosing the right data visualization types. Choose your layout carefully.