Remove Data Visualization Remove Finance Remove Predictive Analytics Remove Procurement
article thumbnail

A Guide To The Top 14 Types Of Reports With Examples Of When To Use Them

Data Pine

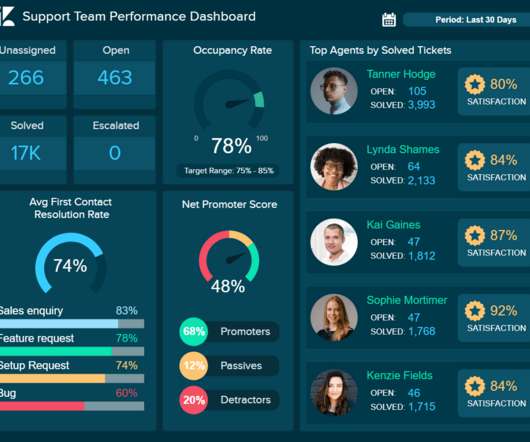
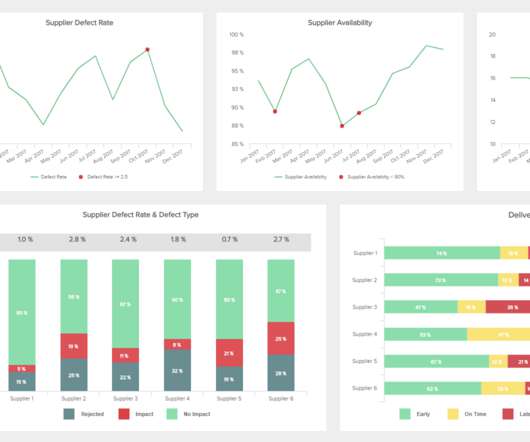
With this information in hand, businesses can build strategies based on analytical evidence and not simple intuition. With the use of the right BI reporting tool businesses can generate various types of analytical reports that include accurate forecasts via predictive analytics technologies.

article thumbnail

What Is The Difference Between Business Intelligence And Analytics?

Data Pine

On the other hand, BA is concerned with more advanced applications such as predictive analytics and statistic modeling. This also allows the two terms to complement each other to provide a complete picture of the data. BI dashboards , offer the possibility to filter the data all in one screen to extract deeper conclusions.

Insiders

Sign Up for our Newsletter

This site is protected by reCAPTCHA and the Google Privacy Policy and Terms of Service apply.

article thumbnail

Get The Most Out Of Smart Business Intelligence Reporting

Data Pine

One business report example can focus on finance, another on sales, the third on marketing. Business intelligence and reporting are not just focused on the tracking part, but include forecasting based on predictive analytics and artificial intelligence that can easily help avoid making a costly and time-consuming business decision.

article thumbnail

Utilize The Potential Of Digital Dashboards In A Business Environment

Data Pine

If you’re curious to present your data in a meaningful way, online data visualization is a powerful tool to do so indeed – data-driven dashboards offer a means of gaining access to vital information and delivering it throughout the organization with ease. Bubble plots. Number charts. Area charts.

Digital 75