Remove Data Visualization Remove Finance Remove Innovation Remove Procurement
article thumbnail

Take Advantage Of Modern CEO Dashboards – Examples And Templates

Data Pine

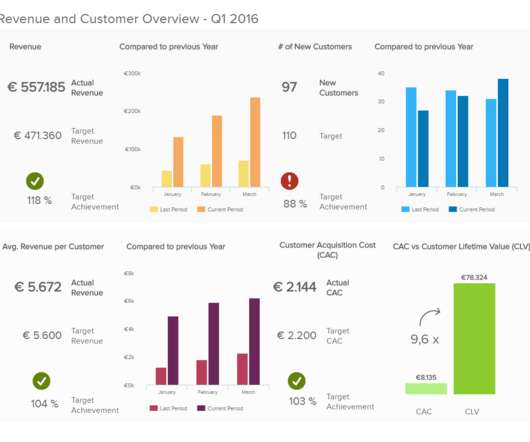
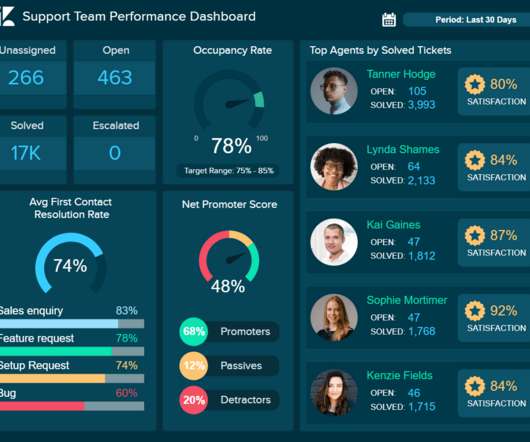
By leveraging smart online data analysis in the right way, you will gain access to insights that will help you develop strategies that foster growth and innovation while keeping your staff motivated, engaged, and happy. Management, marketing, finance & sales in one.

article thumbnail

Your Definitive Guide To Modern & Professional Procurement Reports

Data Pine

It doesn’t matter how innovative your brand is or how groundbreaking your business model might be; if your business is ridden with glaring inefficiencies, your potential for growth is eventually going to get stunted. And procurement reporting is no exception to this. What Are Procurement Reports?

Insiders

Sign Up for our Newsletter

This site is protected by reCAPTCHA and the Google Privacy Policy and Terms of Service apply.

article thumbnail

A Complete Guide On How To Set Smart KPI Targets And Goals

Data Pine

On the other hand, if you expect growth to come from existing clients you can set a product innovation target that justifies a price rise and directly affect your repeat purchase ratios. The SUM is a metric that tracks the percentage of spending that is actively managed by the procurement manager. Summarize everything and double-check.

article thumbnail

KPI Management And Best Practices: How To Find The Perfect KPI Solutions?

Data Pine

Offer online data visualization tools that are clear, concise, and tell a story. Provide access to all the data and insights you need for success in one central space – no need for spreadsheets and complex files. Finance: How do we handle the company’s assets? This example comes from the financial industry.

article thumbnail

A Guide To The Top 14 Types Of Reports With Examples Of When To Use Them

Data Pine

Rather is the sales department, customer service, logistics, or finances, this specific report type help track and optimize performance on a deeper level. click to enlarge** The image above is a department report created with an online data analysis tool and it is tracking the performance of a support team.

article thumbnail

What Is The Difference Between Business Intelligence And Analytics?

Data Pine

The correct answer is: everybody has an opinion, but nobody knows, and you shouldn’t care.” – Timo Elliot, Innovation Evangelist at SAP. Well, what if you do care about the difference between business intelligence and data analytics? Your Chance: Want to extract the maximum potential out of your data?

article thumbnail

Utilize The Potential Of Digital Dashboards In A Business Environment

Data Pine

If you’re curious to present your data in a meaningful way, online data visualization is a powerful tool to do so indeed – data-driven dashboards offer a means of gaining access to vital information and delivering it throughout the organization with ease. Bubble plots. Number charts. Area charts.

Digital 75