

Addressing the importance of data and visualization skills in health and healthcare fields
Tableau
JANUARY 26, 2022
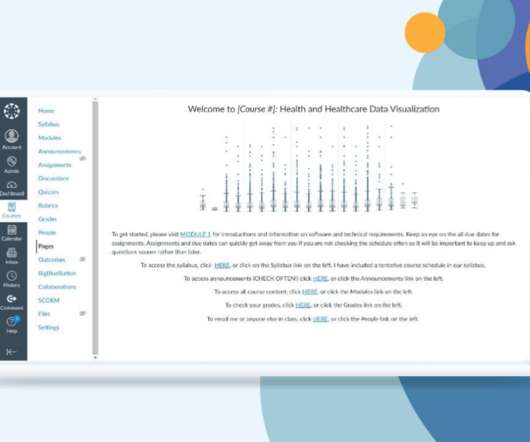
According to the National Institutes of Health (NIH), “Data visualization is becoming an increasingly common method of presenting large and complex data sets, but the principles of visual communication are not widely understood or practiced.” Homepage of Health and Healthcare Data Visualization course in Canvas.


Let's personalize your content