article thumbnail

Top Power BI Alternatives for Dynamic Data Visualization | Simplilearn

Simplilearn

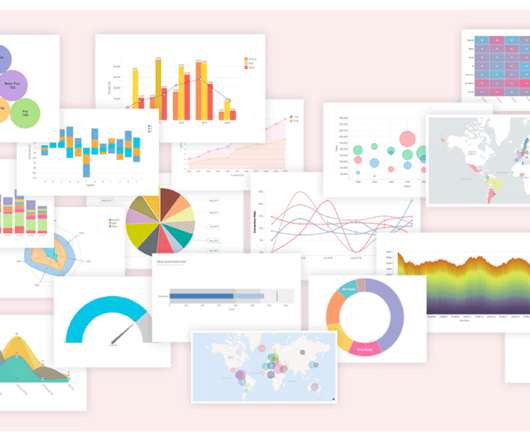
Power BI is popular for data visualization technology. However, a variety of products other than Power BI can be found in the market, offering features like data visualization. These user-friendly tools focus on being the alternatives to Power BI in mastering data visualization. Read More.

article thumbnail

Data Visualization Boosts Business Scalability with Sales Mapping

Smart Data Collective

Data visualization tools have become very useful for many businesses. Companies use data visualization for trend mapping, data contextualization and various forms of business optimization. billion on data visualization technology within the next three years. Increasing Overall Productivity.

Insiders

Sign Up for our Newsletter

This site is protected by reCAPTCHA and the Google Privacy Policy and Terms of Service apply.

article thumbnail

Types Of Data Visualization You Should Know | Simplilearn

Simplilearn

Visualization has become an integral aspect of data analysis in today's data-driven environment. Businesses may obtain insights and make data-driven choices by using a variety of successful data visualization approaches. This article will examine the many types of data visualization.

article thumbnail

Exploring Iris Data Visualization with Seaborn’s Violin Plot in Python

Analysts Corner

Introduction Data visualization is an essential skill for anyone who wants to explore and understand large datasets. One of the most popular libraries for data visualization in Python is Seaborn. In this article, we will focus on understanding how to use Seaborn’s violin plots to visualize the Iris dataset.

article thumbnail

15 Most Popular Data Visualization Tools Used by Businesses Today | Simplilearn

Simplilearn

According to a Fortune Business Insights report, the data visualization market in 2019 was estimated at $8.85 By 2027, the market worth is expected to be $19.20 billion at a compound annual growth rate of 10.2%. Read More.

article thumbnail

Charting the Heart: Data Visualizations on Love

Tableau

At the end of 2022, I embarked on a personal project to track my dating experiences throughout the year, leading to a laugh-out-loud visualization that captured a rollercoaster of emotions. Each visualization provides a fresh perspective on the timeless theme of love. If you love movies, join in on Tableau's Data + Movies challenge.

article thumbnail

The Fascinating Role of Data Visualization and Techniques for Assorted Variables

Smart Data Collective

While the collection and processing of data involves a lot of technology and expertise, creating a visual representation of the data, which can be read and understood by one and all, also requires an intuitive excellence. Such excellence predominantly is needed to select visualization formats for a specific set of sample data.