

How to choose the best dashboard tool for your business
BizAcuity
SEPTEMBER 16, 2019
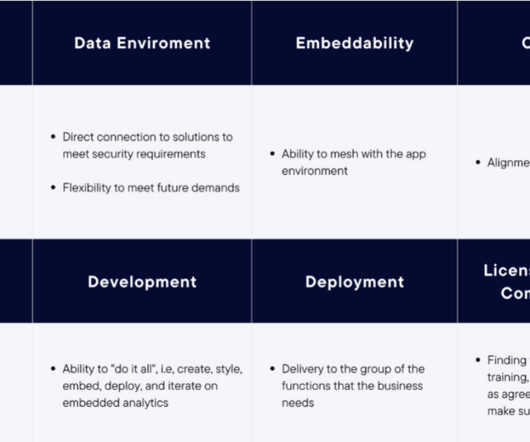
A BI dashboard — or business intelligence dashboard — is an information management tool that uses data visualization to display KPIs (key performance indicators) tracked by a business to assess various aspects of performance. Be detailed enough to capture finer data and numbers for an effective analysis.


Let's personalize your content