article thumbnail

Understanding Data Drill Down And Drill Through Analysis And Their Role In Efficient Reporting

Data Pine

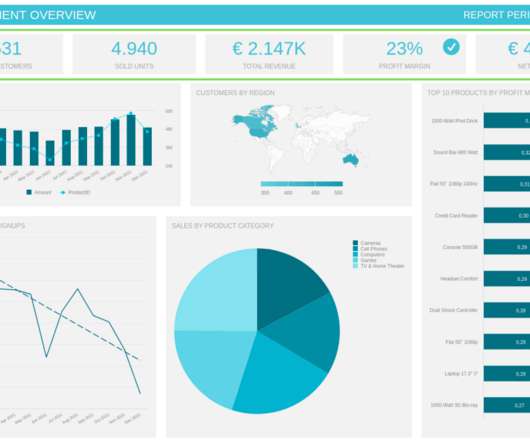
With this thought in mind, BI tools develop multiple solutions to assist businesses in dealing with their information in the most efficient way possible. From automated reporting, predictive analytics, and interactive data visualizations, reporting on data has never been easier. click to enlarge**. What Is Drill Through?

article thumbnail

Uncover The Power Of White Label Dashboards & Reports With Key Features And Examples 

Data Pine

This is an especially valuable practice, especially considering that humans are visual creatures. Enhanced decision making : Relying on a white labeled report with all its analytical functionalities helps organizations generate informed strategies based on their own performance data.

Insiders

Sign Up for our Newsletter

This site is protected by reCAPTCHA and the Google Privacy Policy and Terms of Service apply.

article thumbnail

A Guide To The Methods, Benefits & Problems of The Interpretation of Data

Data Pine

Through the art of streamlined visual communication, data dashboards permit businesses to engage in real-time and informed decision-making and are key instruments in data interpretation. Typically, quantitative data is measured by visually presenting correlation tests between two or more variables of significance.

article thumbnail

A marketing strategist’s approach to customer segmentation

Ntara

Check out our Leveraging customer data to help businesses win big blog to read more about our methodology.). After we’ve identified significant customer segments, we formally prepare our findings into formats your business can use to make decisions, inform strategies, and reference in the field. How many responses do you need?

Digital 96
article thumbnail

How to conduct a customer segmentation study

Ntara

Check out our Leveraging customer data to help businesses win big blog to read more about our methodology.) . After we’ve identified significant customer segments, we formally prepare our findings into formats your business can use to make decisions, inform strategies, and reference in the field. .

Digital 52
article thumbnail

A Beginners Guide To The Power Of Area Charts – See Examples, Types & Best Practices 

Data Pine

2) Types Of Area Charts 3) When To Use Area Graphs 4) Area Diagram Best Practices 5) Area Chart Examples It is no secret that the human brain processes visual information way faster than text or numbers. Your Chance: Want to test a modern data visualization software for free? Let’s get started with the area chart definition!

article thumbnail

Unveiling 10.3: Astera Introduces New, Innovative AI Features and Enhanced Capabilities

Astera

This empowers large enterprises to swiftly extract valuable information, leading to quicker insights and informed strategies. Its user-friendly interface simplifies data science processes, enabling effortless visualization and configuration of models.