

Exploratory Data Analysis using Data Visualization Techniques!
The BAWorld
NOVEMBER 22, 2021
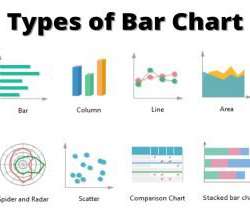
We can define exploratory data analysis as the essential data investigation process before the formal analysis to spot patterns and anomalies, discover trends, and test hypotheses with summary statistics and visualizations. It gives an idea about the data we will be digging deep into while analyzing. Bar charts.


Let's personalize your content