

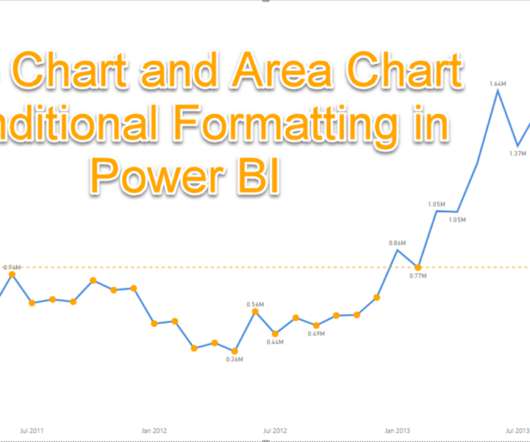
Quick Tips: Line Chart and Area Chart Conditional Formatting in Power BI
BI Insight
DECEMBER 5, 2019
In this post I show you a very quick trick to format Line Chart and Area Chart conditionally in Power BI. As this is a “Quick Tip” I’m going to keep this post really short. One of my customers asked me to show time series in line charts and area charts.


Let's personalize your content