Remove Data Warehouse Remove Planning Remove Vision Remove Visualization
article thumbnail

Bridge the Gap Between Reporting and Data Visualization in Power BI

Insight Software

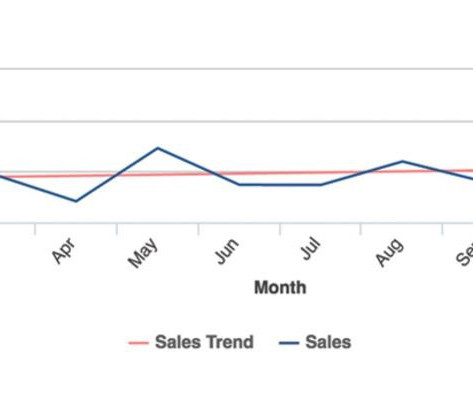
Business intelligence is a key tool, empowering companies to get the most out of their data by providing tools to analyze information, streamline operations, track performance, and inform decision-making. Power BI can generate easy-to-read visualizations that help stakeholders perform key analysis.

article thumbnail

insightsoftware Recognized in Gartner’s Magic Quadrant for Financial Planning

Insight Software

insightsoftware is thrilled to be recognized as a Niche Player in Gartner’s 2023 Magic Quadrant (MQ) for Financial Planning Software. Earning a place in this MQ is a testament to our commitment to delivering the best budgeting and planning solutions for our customers. What is the Gartner Magic Quadrant?

Insiders

Sign Up for our Newsletter

This site is protected by reCAPTCHA and the Google Privacy Policy and Terms of Service apply.

article thumbnail

Let Real-Time Data Visualization Drive Your Storytelling

Insight Software

When your customers deliver analytics and reporting, the data visualization experience should be a memorable one. Trust is a critical currency in modern data analytics. To have a positive impact, users need to view their analytics as a single source of truth, not a vision of the past. Just a Story, or The Truth?

article thumbnail

Comparing Data Visualizations: Bar vs. Stacked, Icons vs. Shapes, and Line vs. Area

Insight Software

Great data visualizations have the power to persuade decision makers to take immediate, appropriate action. When done well, data visualizations help users intuitively grasp data at a glance and provide more meaningful views of information in context. Modern data visualization platforms offer countless options.

article thumbnail

What is a Data Pipeline?

Insight Software

The key components of a data pipeline are typically: Data Sources : The origin of the data, such as a relational database , data warehouse, data lake , file, API, or other data store. This can include tasks such as data ingestion, cleansing, filtering, aggregation, or standardization.

article thumbnail

Go Beyond Data Visualization to Data Storytelling

Insight Software

In the era of big data, it’s especially important to be mindful of that reality. That’s why today’s smart business leaders are using data-driven storytelling to make an impact on the people around them. Raw Data, Visualizations, and Data Storytelling. The Role of Data Visualizations. Access Resource.

article thumbnail

Tax Reports Not Making Cents? Visualizations Are Your Friend

Insight Software

Imagine how much better your finished tax reports and forecasts could be if you were able to halve the time spent on manual data gathering and instead focus on interpreting the numbers. Step 2: Communicate Your Tax Analyses More Effectively with Dashboards and Visualizations. Bring Your Tax Story to Life with CXO for Longview Tax.