Remove Blog Remove Data Management Remove Data Warehouse Remove Embedded Analytics
article thumbnail

Why CIOs Should Weave Data Fabrics Into Their Orgs

Domo

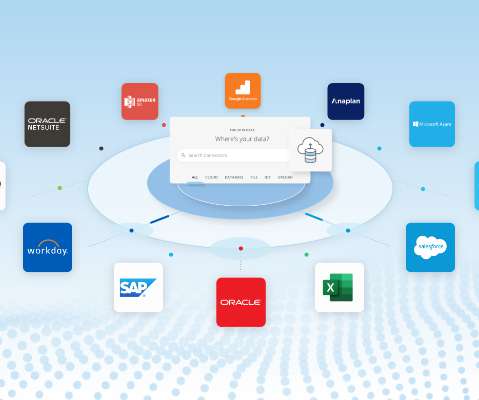
Even though technology transformation is enabling accelerated progress in data engineering, analytics deployment, and predictive modeling to drive business value, deploying a data strategy across cloud systems remains inefficient and cumbersome for CIOs. One of the key obstacles is data access.

article thumbnail

6 Things to Consider When Migrating to the Cloud

Domo

It’s also important to think about how you’re going to manage your cloud vendors/providers. In order to manage your infrastructure such as networks, storage, services, data management, and virtualization, you’ll likely be working with several cloud providers, including cloud data integration and cloud BI providers.

Insiders

Sign Up for our Newsletter

This site is protected by reCAPTCHA and the Google Privacy Policy and Terms of Service apply.

article thumbnail

Top Business Intelligence Features To Boost Your Business Performance

Data Pine

Taking all these into consideration, it is impossible to ignore the benefits that your business can endure from implementing BI tools into their data management process. No matter the size of your data sets, BI tools facilitate the analysis process by letting you extract fresh insights within seconds. c) Join Data Sources.

article thumbnail

How Profectus Delivers Value from Data

Sisense

Every company is becoming a data company. In Data-Powered Businesses , we dive into the ways that companies of all kinds are digitally transforming to make smarter data-driven decisions, monetize their data, and create companies that will thrive in our current era of Big Data.

Vision 59
article thumbnail

How to Build Success Through Strategic ESPP Design

Insight Software

Ready to learn more about how Certent Equity Management enables you to streamline your ESPP management, tighten compliance, minimize risk, and improve your productivity? Check out our blog or schedule a demo today. Get a Demo Streamline your equity administration and cut your reporting from days into a few hours.

article thumbnail

Comparing Data Visualizations: Bar vs. Stacked, Icons vs. Shapes, and Line vs. Area

Insight Software

When to Use Icons: If you’re displaying data in another format—such as in a brochure or a blog post—you may choose to show an icon with a clear percentage number next to it. As long as all the parts add up to one whole, then a pie chart is a god choice. These charts are much clearer than an icon.

article thumbnail

Learning Qlik Sense: Top Tips for Getting Started with Qlik

Insight Software

And if you’re looking for free resources, Qlik’s blog has a wealth of information available at the click of a button. Qlik users have an active online presence, and it’s easy to find blogs and video tutorials with a basic internet search. Within this space, you’ll find everything from Forums for Data Analytics to Events and Support.