Remove Agile Remove Data Warehouse Remove Vision Remove Visualization
article thumbnail

Why CIOs Should Weave Data Fabrics Into Their Orgs

Domo

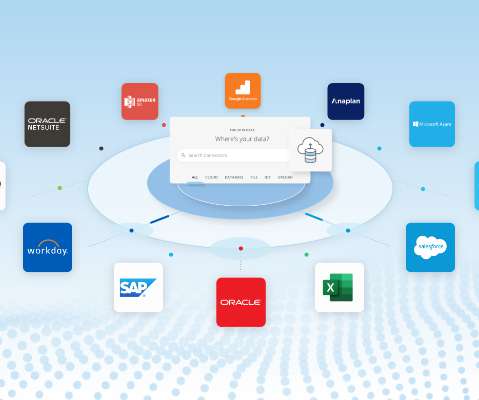
All too often, enterprise data is siloed across various business systems, SaaS systems, and enterprise data warehouses, leading to shadow IT and “BI breadlines”—a long queue of BI requests that can keep getting longer, compounding unresolved requests for data engineering services.

article thumbnail

16 Best Business Intelligence Books To Get You Off the Ground With BI

Data Pine

With ‘big data’ transcending one of the biggest business intelligence buzzwords of recent years to a living, breathing driver of sustainable success in a competitive digital age, it might be time to jump on the statistical bandwagon, so to speak. click for book source**. One of the best books on business analytics you’ll ever read.

Insiders

Sign Up for our Newsletter

This site is protected by reCAPTCHA and the Google Privacy Policy and Terms of Service apply.

article thumbnail

It’s Time for Data Historians to Become … History

Actian

There are many Operational Technology (OT) environments within manufacturing, oil and gas, engineering research, and countless other industries where complex equipment, machinery, and networks of sensors and devices generate time-series data. Technology that empowers historical data to shape the future.

article thumbnail

Top 5 EPM Reporting Templates

Insight Software

A smart design combined with straightforward visualizations allow this template to communicate volumes. EPM tools automatically pull information from consolidated group financial data or to budgeting and planning data. Step 7: Translate Information Visually. KPIs Overview. Step 2: Choose Reporting Templates.

Finance 52
article thumbnail

Your Effective Roadmap To Implement A Successful Business Intelligence Strategy

Data Pine

You define the strategy in terms of vision, organization, processes, architecture, and solutions, and then draw a roadmap based on the assessment, the priority, and the feasibility. This should also include creating a plan for data storage services. Are the data sources going to remain disparate? Develop a “Data Dictionary”.

article thumbnail

Comparing Data Visualizations: Bar vs. Stacked, Icons vs. Shapes, and Line vs. Area

Insight Software

Great data visualizations have the power to persuade decision makers to take immediate, appropriate action. When done well, data visualizations help users intuitively grasp data at a glance and provide more meaningful views of information in context. Modern data visualization platforms offer countless options.

article thumbnail

Shared Data Reporting: Deep Excel Functionality Meets Web-Based Dashboards

Insight Software

When surrounded by challenges from both outside and inside the organization, how can finance teams overcome these challenges to gain the agility they need to thrive? ERP-Native Reporting Stifles Agility ERPs are complex, and you often need to go beyond what’s available with native ERP reporting to generate custom and ad hoc reports.