

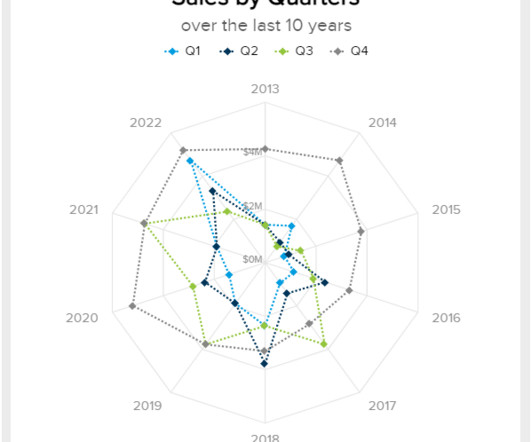
A Complete Guide To Spider Charts With Best Practices And Examples Of When To Use Them
Data Pine
APRIL 25, 2023
2) When To Use Spider Graphs 3) Types Of Radar Charts 4) Radar Graph Best Practices 5) Spider Chart Examples If you are reading this blog post then you must be somewhat aware of the value of data visualization. Now, it is the turn of a complex yet visually engaging visual: spider charts. Table of Contents 1) What Is A Spider Chart?


Let's personalize your content