

How to Define A Measure Table in Power BI Desktop
BI Insight
MARCH 28, 2016
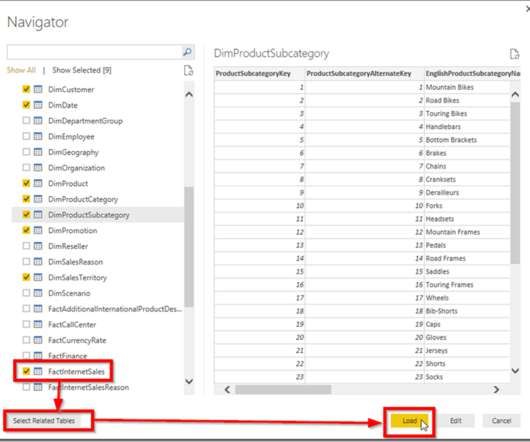
In this post I show you a simple trick to make your Power BI model more organised and more readable. I call it creating a “Measure Table”. The story is that I was working on a model with lots of tables. The post How to Define A Measure Table in Power BI Desktop appeared first on BI Insight.


Let's personalize your content