

Gartner BI & Analytics Summit, Mumbai, 2017: My Take
ElegantJ BI
JUNE 16, 2017
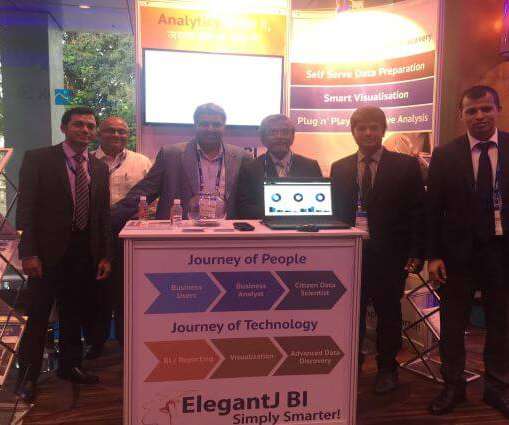
On June 6 and 7, 2017, I had the pleasure of attending and participating in the Gartner Business Intelligence, Analytics and Information Management Summit in Powai, Mumbai, India. The 2017 Summit was larger and even more productive than the Summit of 2016, with more than 650 delegates in attendance.


Let's personalize your content