
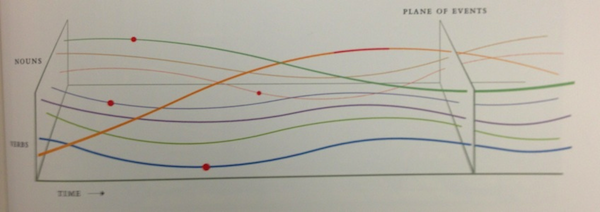
From Edward Tufte's Visual Explanations, a diagram based on Salman Rushdie‘s description of the Indian epid Kathasaritsagara or Ocean of the Streams of Story.
“Gartner projects that by 2025, data stories will be the most widespread way of consuming analytics” — Data Trends
Data Storytelling is the evolution beyond data visualizations. It is a recognition that well-designed charts aren’t enough to move people to action. We need to use the tools and techniques of narrative stories to engage audiences with data. While the term has been around for a while, we are still early in the discussion about what Data Storytelling means and how it should be practiced. It is fair to wonder:
Is data storytelling more than a catchy phrase?
Where does data storytelling fit into the broader landscape of data exploration, visualization, and presentation?
How can the traditional tools of storytelling improve how we communicate with data?
Is it more about story-telling or story-finding?
Many of the bright minds in the data visualization field have started to tackle these questions -- and it is something that we've been exploring at Juice in our work. Below you'll find a collection of some of the best (1) blog posts and articles, (2) presentations, (3) books and other resources; (4) Podcasts; and (5) research papers on this topic.
And while you’re here, you should sign up to try our unique data storytelling platform for building your own data stories.
1. Posts and Articles about Data Storytelling
The Next Chapter in Analytics: Data Storytelling by Beth Stackpole. “As with any good story, a data tale needs a beginning, a middle, an end, and some actionable insights. Data scientists aren’t always up to the job.”
A Data Scientist's Real Job: Storytelling by Jeff Bladt and Bob Filbin "In short, we're tasked with transforming data into directives. Good analysis parses numerical outputs into an understanding of the organization. We "humanize" the data by turning raw numbers into a story about our performance."
Coffee & Empathy: Why data without a soul is meaningless by Om Malik "The idea of combining data, emotion and empathy as part of a narrative is something every company — old, new, young and mature — has to internalize. If they don’t, they will find themselves on the wrong side of history."
Look ma, no story! by Moritz Stefaner "Tools have no stories to them. Tools can reveal stories, help us tell stories, but they are neither the story itself nor the storyteller. Portraits have no story to them either. Like a photo portrait of a person, a visualization portrait of a data set can allow you to capture many facets of a bigger whole, but there is not a single story there, either."
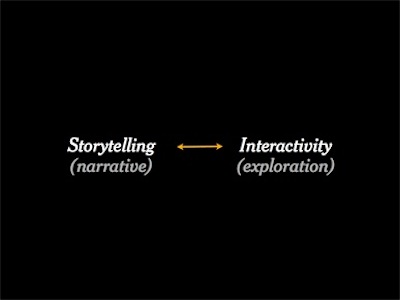
Discussion: Storytelling and success stories by Andy Kirk "I just wanted to share my view on the distinction I personally make between the two main types of visualisation function: exploratory and explanatory"
The secret to storytelling is in the editing by Garr Reynolds "Although it is a film about the role of editing in filmmaking, the lessons and principles are applicable to other creative work such as writing, and storytelling of all kinds, including presentations."
Visualising data: can you see stories? by Chris Twigg "Narrative can on the one hand be broken down into a set of universal laws and principles that may transcend mediums. Stories have temporality in common (they deal with time) as well as causation (they deal with cause and effect of something). On the other hand there are the more media specific narrative affordances as for example in the way that film, opera, novel and data visualisation – because of their physicality and the dimensions open to them – would be able to give a different ‘staging’ of a story."
Data Visualization as Storytelling: A Stretched Analogy by Zach Gemignani "For practitioners of the craft, connecting our work to stories feels satisfying — it is a call to raise our standards and an opportunity to enhance the influence of our field. Stories evoke images of rapt audiences, dramatic arcs, and unexpected plot twists. Unfortunately this analogy is a stretch."
Why good storytelling helps you design great products by Braden Kowitz "It’s not uncommon for designers to confuse a beautiful looking product with one that works beautifully. A great technique for creating smarter, better products is to approach them using story-centered design."
More Story References and Resources - A list of resources inside a list of resources -- so meta. Jon Schwabish details the materials he used while writing his series on data storytelling.
So What? By Cole Nussbaumer Knaflic “Everyone wants to "tell a story with data." But very often, when we use this phrase, we don't really mean story. We mean what I mentioned above—the point, the key takeaway, the so what?"
Storytelling with Data Visualization: Context is King by Nick Diakopoulos “To fully breathe life back into your data, you need to crack your knuckles and add a dose of written explanation to your visualizations as well. Text provides that vital bit of context layered over the data that helps the audience come to a valid interpretation of what it really means."
Data Storytelling: Separating Fiction from Facts by Brent Dykes “As various people step forward to provide opinions on how to tell data stories, I’ve seen misinformation creep in which—if left unaddressed—could lead aspiring data storytellers astray."
The Role of Data in Data Storytelling by Teradata “An (alarmingly) large number of comments and opinions describe in great lengths how people in technical professions are unable to explain or storytell their experiments and findings. Have we regressed that far that something as natural as stories has disappeared from our skillset? Not really."
Will You Present the Data As-Is, or Tell a Story? By Ann K. Emery “It’s not that one visualization style is better or worse than the other. They’re apples and oranges. I want you to figure out when your viewers are expecting to see each style and then learn how to switch back and forth."
Implied Stories (and Data Vis) by Lynn Cherny “Even very simple stories, whatever the discourse form, rely on the reader filling in a lot of invisible holes. Some of the interpretation we do is so 'obvious' that only sociologists or cognitive scientists can make explicit the jumps we don't notice we're wired to make."
30 Days to Data Storytelling by Juice Analytics
2. Presentations about Data Storytelling
Telling Stories with Data in 3 Steps from Harvard Business Review
Making data mean more through storytelling by Ben Wellington
Storytelling with Data with Cole Nussbaumer Knaflic
How to Tell Stories with Data (Really) by Edward Segal PDF version


Storytelling with data visualization: Questions and challenges by Albert Cairo

Storytelling with Data by Jonathan Corum
The Secret Structure of Great Talks (TED Talk) by Nancy Duarte
Reaching Beyond Data Visualization by Zach Gemignani
Storytelling with data visualization: Questions and challenges by Alberto Cairo
Data stories - how to combine the power of storytelling with effective data visualization by Miriam Gilbert
Making data mean more through storytelling by Ben Wellington
The Age of Insight: Telling Stories with Data from Google News Lab
The science of storytelling by Prasad Setty
Storytelling and data Why? How? When? By Robert Kosara
Data Visualization and Storytelling by Alberto Cairo
3. Books and Other Resources about Data Storytelling
DataStory: Explain Data and Inspire Action Through Story by Nancy Duarte
Illuminate: Ignite Change Through Speeches, Stories, Ceremonies, and Symbols by Nancy Duarte & Patti Sanchez
Storytelling with Data: A Data Visualization Guide for Business Professionals by Cole Nussbaumer Knaflic
The Complete Collection of Interactive Data Storytelling Lessons by Juice Analytics
Hans Rosling's TED Talks "What sets Rosling apart isn't just his apt observations of broad social and economic trends, but the stunning way he presents them. Guaranteed: You've never seen data presented like this. By any logic, a presentation that tracks global health and poverty trends should be, in a word: boring. But in Rosling's hands, data sings. Trends come to life. And the big picture — usually hazy at best — snaps into sharp focus."
Nightingale, The Journal of the Data Visualization Society A collection of articles written by data visualization and storytelling experts delivered by Medium.
Telling Your Data Story by Scott Taylor. The Data Whisperer's practical guide to explaining and understanding the strategic value of data management.
Data-Driven Storytelling by Riche, Hurter, Diakopoulos, and Carpendale. Resulting from unique discussions between data visualization researchers and data journalists, it offers an integrated definition of the topic, presents vivid examples and patterns for data storytelling, and calls out key challenges and new opportunities for researchers and practitioners.
Robert McKee, Godfather of Storytelling (Wikipedia) Rather than simply handling "mechanical" aspects of fiction technique such as plot or dialogue taken individually, McKee examines the narrative structure of a work and what makes the story compelling or not. This could work equally as well as an analysis of any other genre or form of narrative, whether in screenplay or any other form, and could also encompass nonfiction works as long as they attempt to "tell a story".
Stories Through Data Exploring storytelling in data visualization. A collection of visualizations sorted by Chris Twigg's narrative analysis framework.
13pt Information Graphics Gallery of examples from the studio of Jonathan Corum, an information designer and science graphics editor at The New York Times.
Pixar's 22 Rules of Storytelling "Give your characters opinions. Passive/malleable might seem likable to you as you write, but it’s poison to the audience."
4. Podcasts about Data Storytelling
Stats + Stories with John Bailer and Rosemary Pennington
Present Beyond Measure with Lea Pica
Visual Storytelling w/ Alberto Cairo and Robert Kosara by Data Stories (Enrico Bertini and Moritz Stefaner)
Storytelling with Data by Cole Nussbaumer Knaflic
Adam Greco’s 5 Analytics Data Storytelling Strategies by The Present Beyond Measure Show (Lea Pica)
5. Research Papers about Data Storytelling
Visualization Rhetoric: Framing Effects in Narrative Visualization by Nick Diakopoulos (Summary, Research Paper) "We carefully analyzed 51 narrative visualizations and constructed a taxonomy of rhetorical techniques we found being used. We observed rhetorical techniques being employed at four different editorial layers of a visualization: data, visual representation, annotations, and interactivity. The five main classes of rhetoric we found being used include: information access (e.g. how data is omitted or aggregated), provenance (e.g. how data sources are explained and how uncertainty is shown), mapping (e.g. the use of visual metaphor), linguistic techniques (e.g. irony or apostrophe), and procedural rhetoric (e.g. how default views anchor interpretation)."
Narrative Visualization: Telling Stories with Data by E. Segel and J. Heer (Abstract, Research Paper) "We systematically review the design space of this emerging class of visualizations. Drawing on case studies from news media to visualization research, we identify distinct genres of narrative visualization. We characterize these design differences, together with interactivity and messaging, in terms of the balance between the narrative flow intended by the author (imposed by graphical elements and the interface) and story discovery on the part of the reader (often through interactive exploration)."
Storytelling: The Next Step for Visualization by Robert Kosara and Jack Mackinlay "Presentation and communication of data have so far played a minor role in visualization research, with most work focused on exploration and analysis. We propose that presentation, in particular using elements from storytelling, is the next logical step and should be a research focus of at least equal importance as each of the other two."
What Storytelling Can Do for Information Visualization (PDF) by Nahum Gershon and Ward Page "Effective presentations using the storytelling approach require skills like those familiar to movie directors, beyond a technical expert’s knowledge of computer engineering and science. Creating a presentation is not just a matter of being literate in visual media and storytelling but depends on a frame of mind that caters to other modes of human information processing and thinking."
The Enchanted Imagination: Storytelling's Power to Entrance Listeners "While storytelling has flourished, there has not been a concomitant surge in research of the art form. One element of storytelling has remained nearly unconsidered, and it is, perhaps, the most profound and influential characteristic of storytelling: its power to entrance those who listen."