We know that ChatGPT is remarkable at generating text. It is also a powerful tool for summarizing text. It can compress a long article down to the CliffsNotes version in an instant.
How does it do with data? With some prompting guidance, I was able to teach ChatGPT an approach for summarizing a data table. Understanding what you are working with in data is often the first step before diving into analysis. I was impressed with the results once I walked ChatGPT through my general thought process.
I started with this prompt:
Step 1. Describe what each row in the data set represents.
Knowing what you are working in a data set starts at the row level. I found ChatGPT was exceptional at identifying the meaning of the individual rows in my tests. For example:

Step 2. Change the data field labels to make them more human readable, use proper capitalization, expand out abbreviations, and remove non-alphabet and non-numeric characters.
Many data files arrive with column names written by DBAs that are hard to decipher. Take this collection of data fields:
FTResTuition
PTResTuition
FTNonResTuition
PTNonResTuition
If you are familiar with the data, these names may be obvious. Fortunately ChatGPT is able to turn those into:
Full-time Resident Tuition
Part-time Resident Tuition
Full-time Non-Resident Tuition
Part-time Non-Resident Tuition
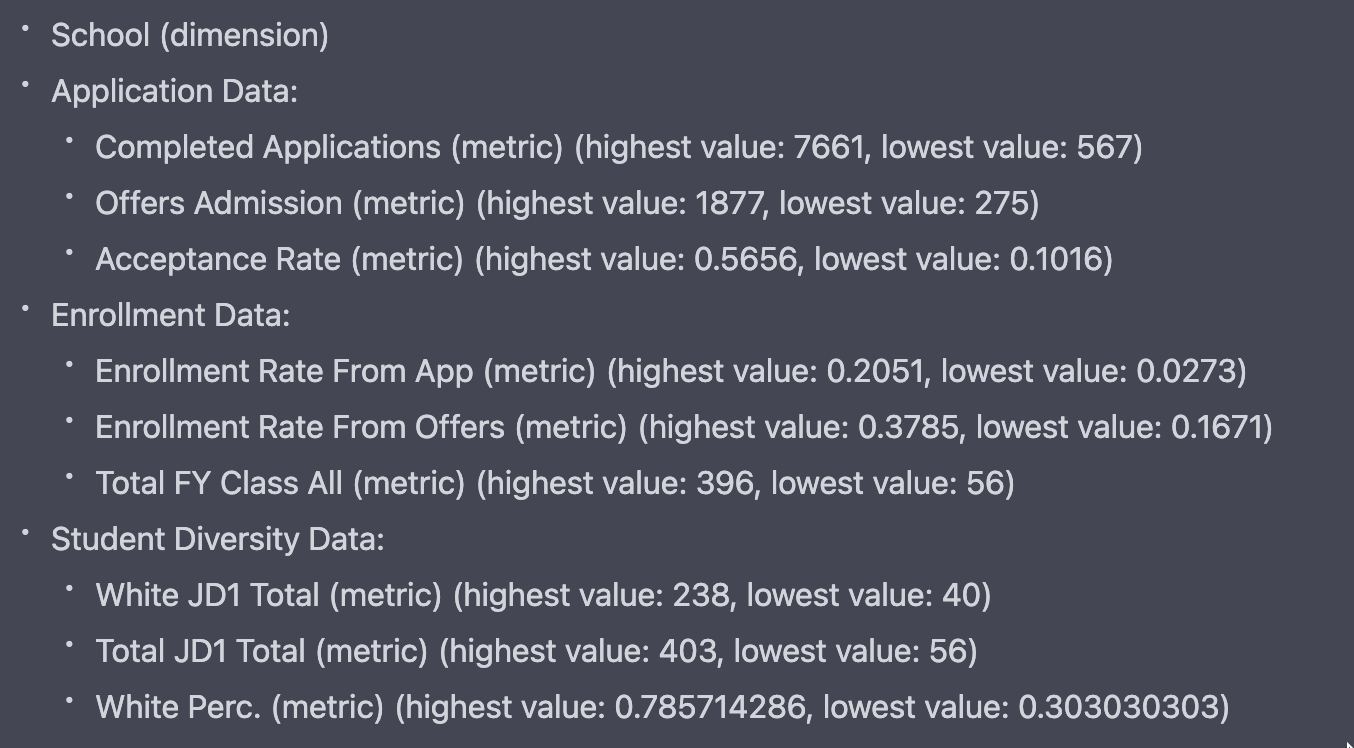
Step 3. Group the data fields by topic or other logical grouping. For each data field, identify if it is a metric, dimension, boolean, or date.
Finding similar concepts is another Large Language Model strength. When you are dealing with data tables with dozens of columns, it can be helpful to understand how those data fields fit together. Equally impressive is the ability for ChatGPT to understand different data types.
Step 4. For each metric data field, show the highest and lowest value in parentheses. For each date field, show the earliest and latest date in parentheses. For each dimension, show the most frequently occurring value in parentheses
It can be really helpful to get a sense of your data by seeing the range of values and common values.
Step 5. Identify any data fields that have many null or empty values. Label these data fields as "null or empty”. Also, identify any data fields that have all the same value. Describe these data fields as "uninteresting"
Finally, data tables with lots of columns often have a lot of cruft — the blank or poorly populated fields that are better to push aside as you thinking about where you want to focus.
After defining all these steps, I played around with how I wanted it to render the results. I ultimately decided to consolidate steps 2 through 4, and suppress ChatGPT’s inclination to be verbose about the instructions. Here’s the final prompt that I landed on:
I want you to use the following Data Summarization process on a data set:
Step 1. Describe what each row in the data set represents
Step 2. Change the data field labels to make them more human readable, use proper capitalization, expand out abbreviations, and remove non-alphabet and non-numeric characters. Group the data fields by topic or other logical grouping. For each data field, identify if it is a metric, dimension, boolean, or date. For each metric data field, show the highest and lowest value in parentheses. For each date field, show the earliest and latest date in parentheses. For each dimension, show the most frequently occurring value in parentheses
Step 3. Identify any data fields that have many null or empty values. Label these data fields as "null or empty”. Also, identify any data fields that have all the same value. Describe these data fields as "uninteresting"
When you show the results, you can write the Step number but don’t need to include the step description. Are you ready for some data?
After pasting that full prompt into the chat window, I simply copy and pasted a chunk of data from Excel to get a result that looks like this: