The most common mistake in ineffective data products is an inability to make difficult decisions about what information is most important. Amanda Cox of The New York Times graphics department summed up this problem perfectly:
“Data isn’t like your kids—you don’t have to pretend to love them equally.” — Amanda Cox, New York Times Design Group

Photo: Unsplash - Etienne Girardet
Often information gets included in data products for reasons that are superfluous to the purpose, audience, and message—reasons that cater the product to someone influential or use information that has been included historically. The bar should be higher. Here are a few strategies to help narrow down to the information that matters:
Find the core problem
Your data product should be more than a lot of data on a screen or page. It should have a core theme based on the essence of the problem. For example, a sales dashboard may be designed around the question, “How can we more effectively move leads through our pipeline?” Or a marketing dashboard may strive to answer, “How can we optimize our marketing investments?” Finding this core problem can give you the logic and argument for discarding extraneous information.
Ask a better question
Data requirements can quickly turn into a laundry list of unrelated metrics, dimensions, and half-baked analyses. The root of this problem stems from asking, “What would you like to know?” The follow-up question that narrows down the list of requirements is, “What would you do if you knew this information?” This question separates the novel and whimsical desires from the important and actionable information.
Push to the appendix
Sometimes, it is impossible to ignore the requests for certain information to be included in a data product. Multiple audiences demanding a multitude of metrics. In these cases, it can be helpful to create an appendix report that includes some of these requests. Doing so can help keep the focus on the most critical data.
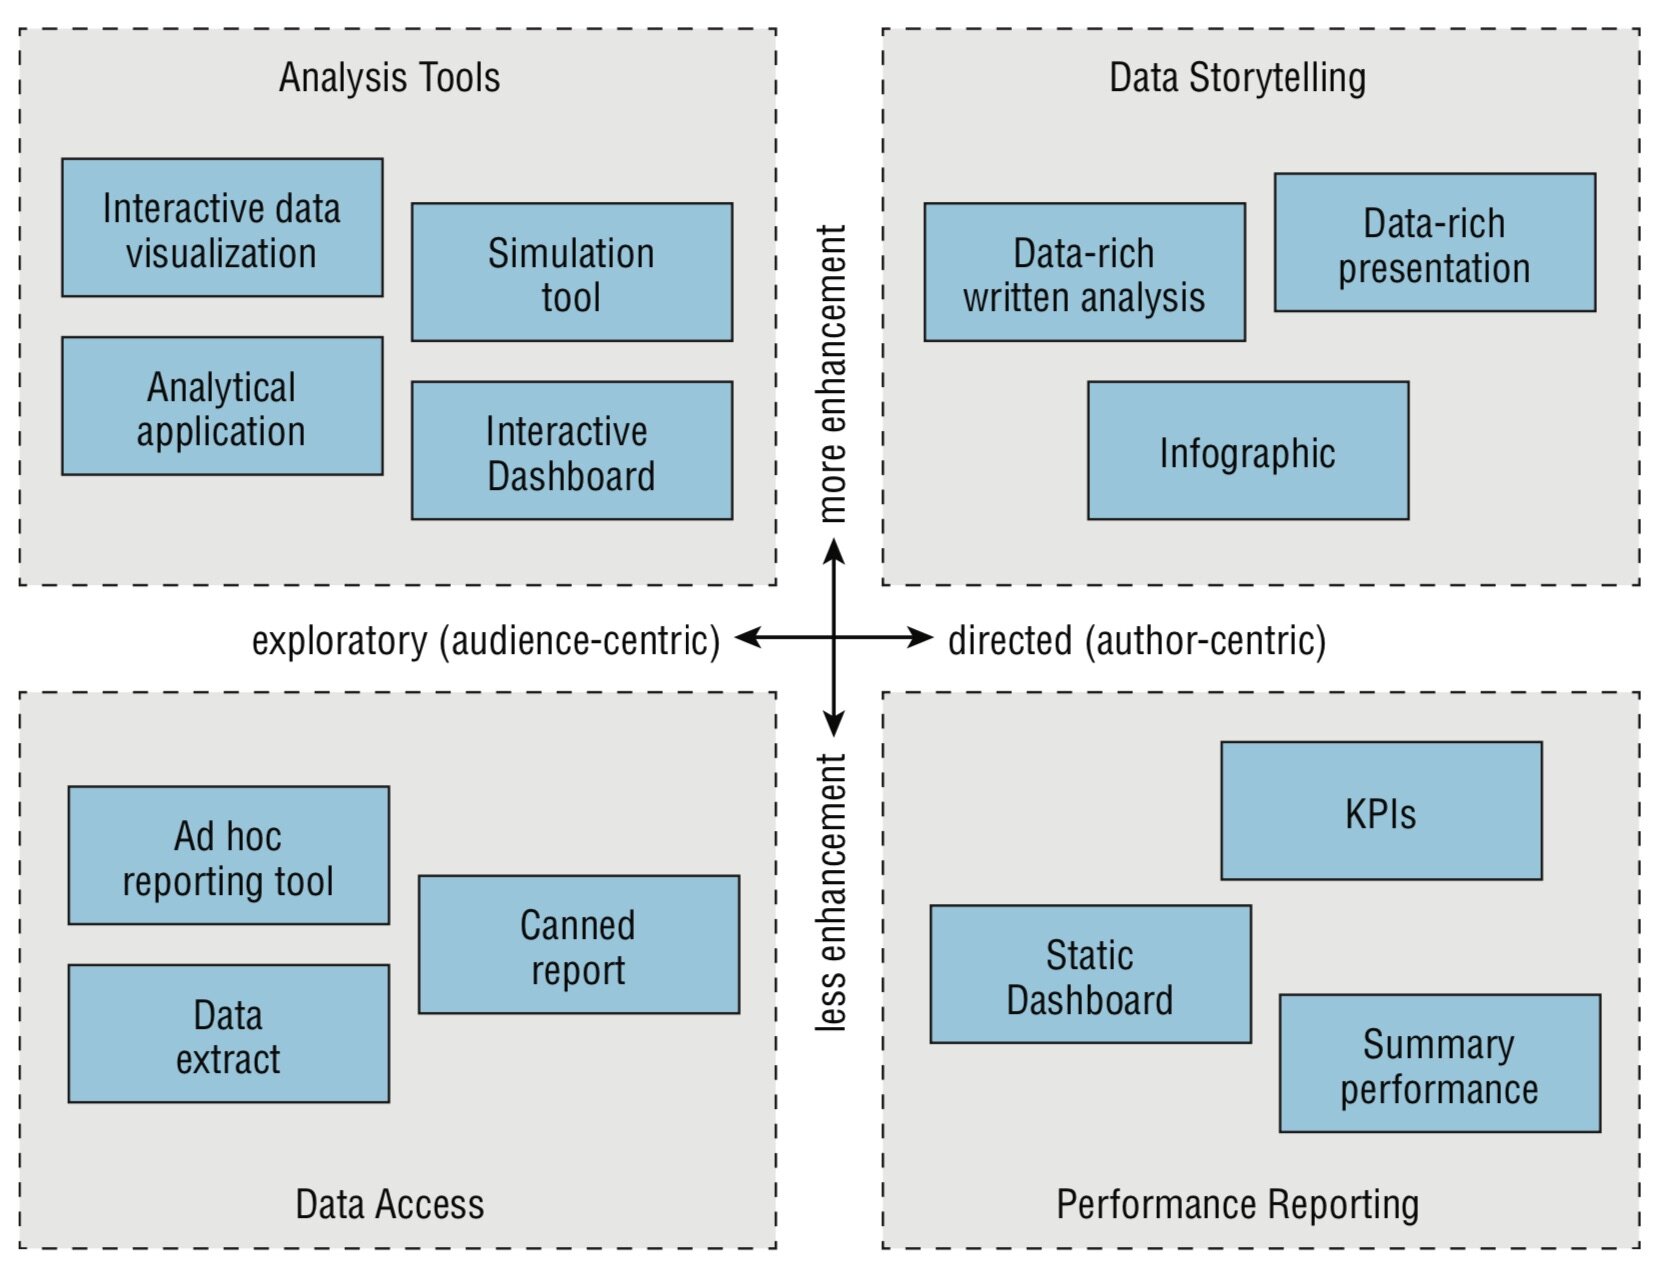
Separate explanation from exploration
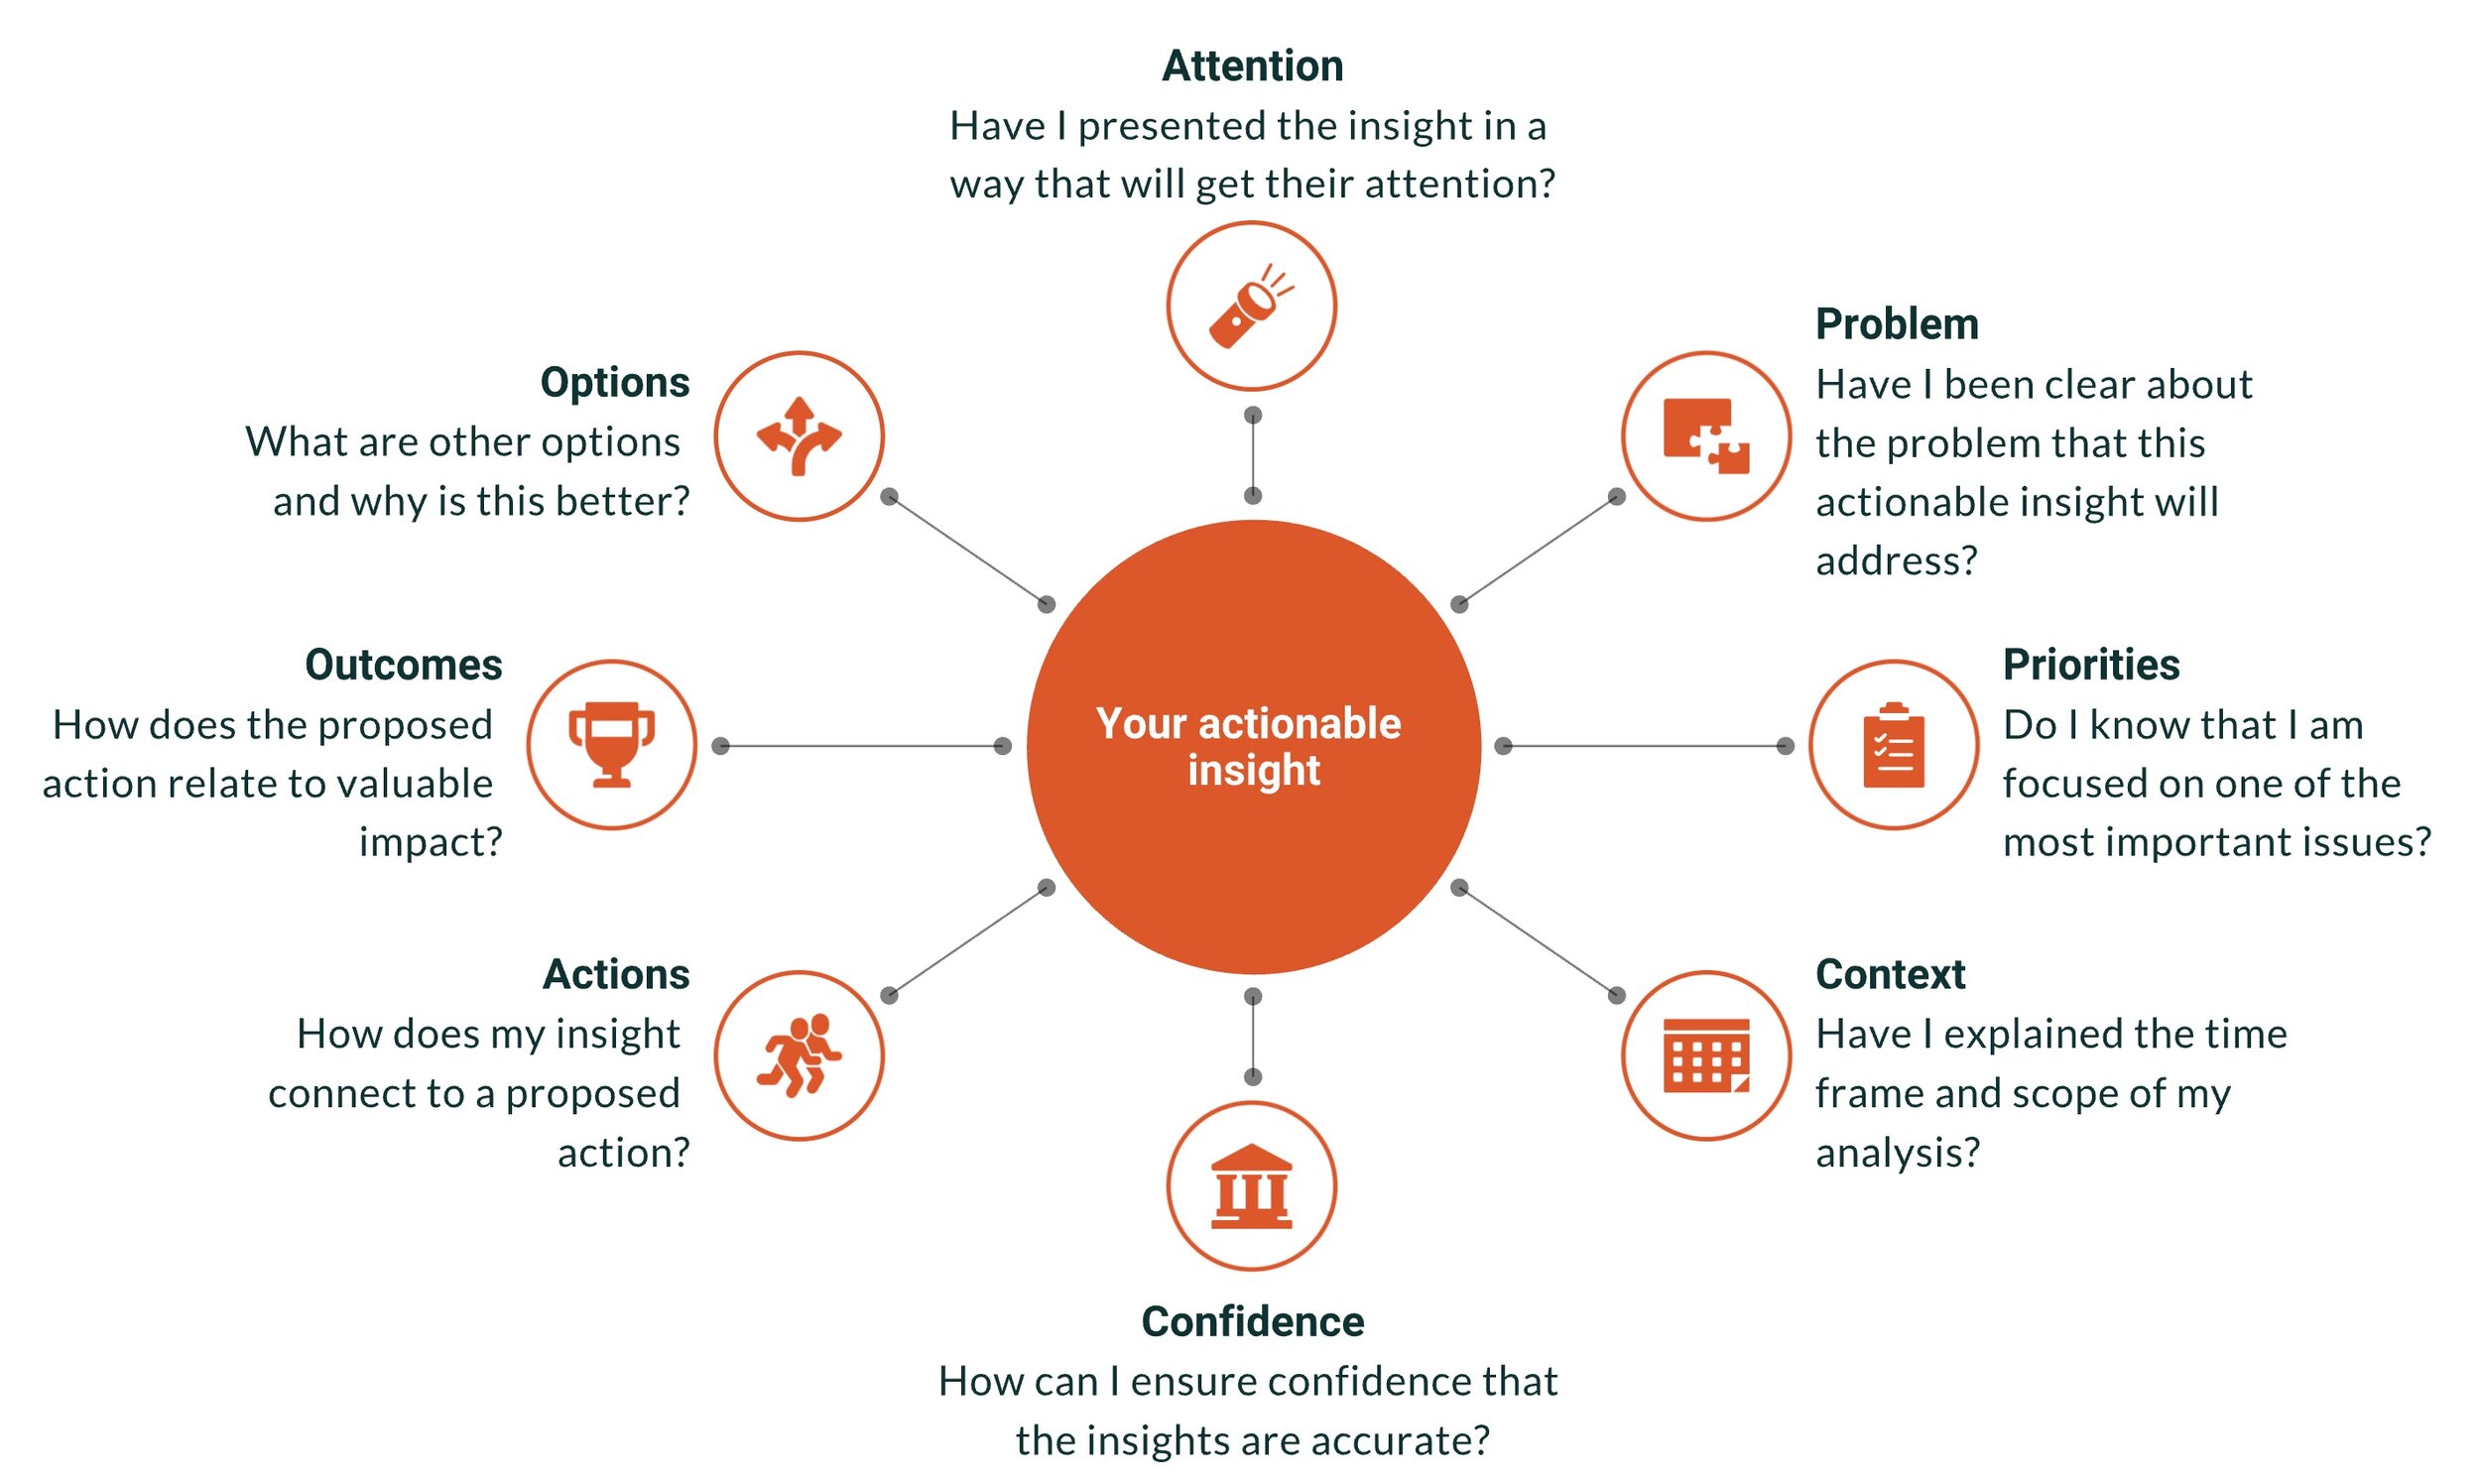
Tools designed for explaining data need to be narrowly focused with a clear topic and address a limited set of questions. Exploration or data analysis tools serve a different purpose. There are many data products designed to give the users a broad palette to explore a variety of data. It helps to understand which of these goals you are setting out to serve. Here’s an article with the five differences between exploration and explanation.
The success of many data products is determined by an ability to distinguish between useful, productive information and interesting but ultimately extraneous information. In short, we echo the sentiment expressed by French author Antoine de Saint-Exupéry:
“Perfection is achieved, not when there is nothing more to add, but when there is nothing left to take away.”