

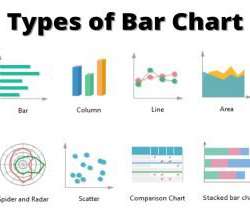
Exploratory Data Analysis using Data Visualization Techniques!
The BAWorld
NOVEMBER 22, 2021
For instance, This example shows the maximum wind speed of different hurricanes with their names that occurred in 2014. Hence, This indicates that this was the strongest hurricanes in 2014; Edouard has the maximum spread of data points in Q3, Bertha has some outliers which need to be investigated.


Let's personalize your content