Understanding Data Drill Down And Drill Through Analysis And Their Role In Efficient Reporting

Table of Contents
It is no secret that the business world is becoming more data-driven by the minute. Every day, more and more decision-makers rely on data coming from multiple sources to make informed strategic decisions. But, as the use of data becomes more popular, the amount of information being collected is also growing exponentially.
With this thought in mind, BI tools develop multiple solutions to assist businesses in dealing with their information in the most efficient way possible. From automated reports, predictive analytics, and interactive data visualizations, reporting on data has never been easier.
Now, if you are just getting started with data analysis and business intelligence, you must be informed about the most efficient ways to manage your data. In this post, we will go through two relevant business intelligence features and how they can bring value to your reporting process. We are talking about drill down and drill through.
But, before we dive into the power of these two analytical features, we need to understand the definition of data drilling.
What Is Data Drilling?
Data drilling is a business intelligence technique that enables companies to analyze their data through different perspectives to extract valuable insights from it. The most common drilling types include drill down, drill up, drill in, and drill through.
Drilling is a fundamental technique that enables organizations of all sizes to find relevant answers to their most important analytical questions by exploring the data contained in interactive reports. It is a great technique to discover trends and patterns as well as the reasons why they happened.
It is important to note that, as with any other analytical process or technique, the value of data drilling will be directly related to the quality of the data as well as its structure. For instance, when it comes to drilling down analysis it is necessary to have data that can be fine-grained into lower levels for the technique to work.
Below we describe the 4 types of data drilling techniques:
- Drill down: As we already hinted above, drilling down means being able to go into lower levels of hierarchical data without the need to change the graph. For example, you can use it to look into the sales by continent, then by country, and then by city.
- Drill up: This one lets you go into higher levels of the data. For example, if you are looking at sales per product, a drill up can enable you to see sales per product category.
- Drill in: This is a more specific one that lets you dig deeper into a specific point within a graph or chart. For example, if you have a line chart displaying sales for the past five years, you can click on a specific year to see each month's performance.
- Drill through: This one lets you visualize additional relevant information that is not contained in the report without the need to jump to a different one. It does this by opening up a pop-up with the additional graph. For example, if you are looking at sales by product a drill thought can show you production costs for each product.
From all the types we just mentioned, the most common ones are drilled down and drilled through analysis and this post will focus on a detailed level of the two. So, without further ado, let’s dive into a deeper explanation of what a drill down can do for your reporting and analysis efforts. Starting with a definition.
Try our professional BI reporting software for 14 days, completely free!
What Is A Drill Down?
Drill down is an analytical feature that allows users to visualize lower levels of hierarchical data in one chart by “nesting” additional variables. Drill down analytics lets you answer questions and extract deeper insights without jumping to another chart or report.
In general, data drills can be added to any chart or data visualization. However, they prove to be specifically useful in tables as they allow you to access additional data to extract deeper insights. For example, breaking down clients by continent, country, and city. Unlike other chart types, tables can especially benefit from this technique because bigger data sets can be compressed without overcrowding the chart.
The main value of drilling down on data is the fact that it lets you interactively dig through hierarchical information without the need to create an extra report or overcrowd your current report with dozens of charts. Like this, you can spot valuable insights on the go all in one place.
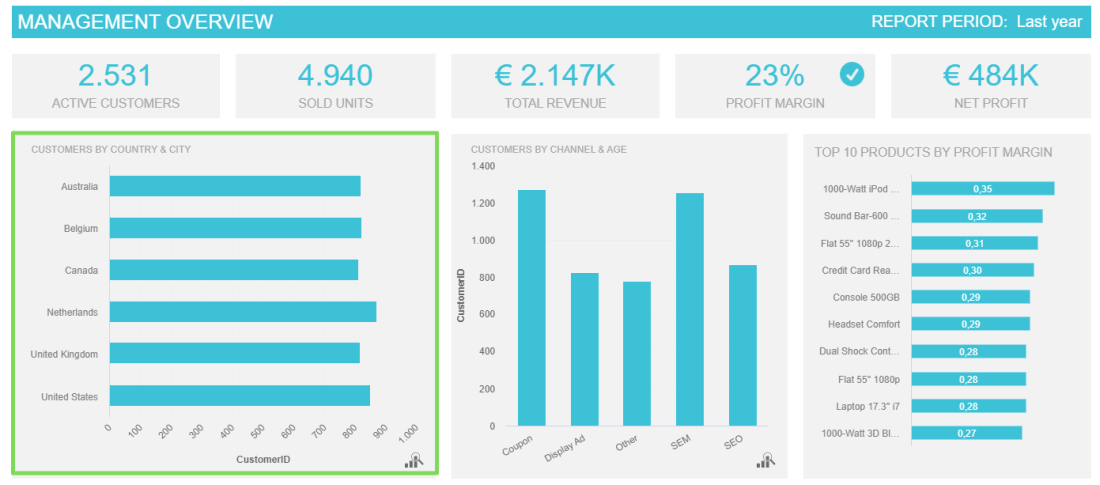
**click to enlarge**
The image above shows a drill down report for management. The chart highlighted in green is showing the active customers by country. A drill here would let you click on this chart to get a lower level of the x-axis like the active users by city. The image below shows the lower level of the data after the drilling is applied.
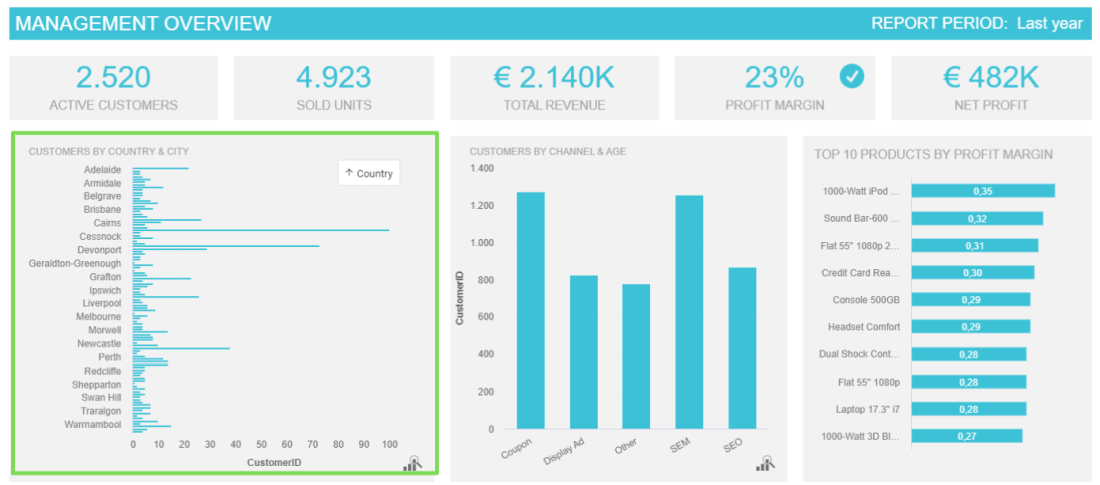
**click to enlarge**
Benefits Of Drill Down Data
Now that you know the drill down meaning let’s go through some of the business-boosting benefits this technology has.
- Improved decision-making: As you saw from the definition above, the biggest benefit of drilling down into your data is the level of deeper insights provided by this technique. When making important strategic decisions just scratching the surface will simply not do. To extract the maximum potential out of your information it is necessary to dig into the lowest levels to find key insights that will inform the business's most important decisions, which will later translate into growth.
- High reporting efficiency: When we work with static reports it is necessary to generate a different visual for every analytical scenario. This translates into crowded reports that make the information harder to understand and the analysis process way less efficient. With drill down capability, there is no need to generate multiple reports or visuals, the data can be easily explored from one location, making the analysis process way more efficient and interactive. In time, this will lead to a more productive and successful reporting process where the load of the report generation task will significantly decrease.
- A friendlier and more accessible analysis: You will likely need to show your reports to different audiences. Some of those audiences might not have the technical knowledge to look at the data and analyze it at a glance. A drill down feature enables these people to explore the information at their will using different types of visuals. Thus making it easier to understand and extract conclusions from it.
Now let's move on to the drill through meaning.
What Is Drill Through?
A drill through is an analytical feature that allows you to visualize additional, more detailed information about a specific KPI in a report. The difference with a drill down is that in a drill though report the new data is opened in a pop-up and not on the same chart.
This analytical technique is often confused with drill down as both practices are very similar. But, as we just mentioned, there is one main factor that makes them different. While drilling down provides granular information within a specific chart or data set, drill throughs display another aspect of the data that might be relevant and it does it by opening a pop-up chart. Although, in some cases, if the data is too big to be displayed using a pop-up, the drill through can also take you to a different dashboard just by clicking on the specific point you want to expand on.
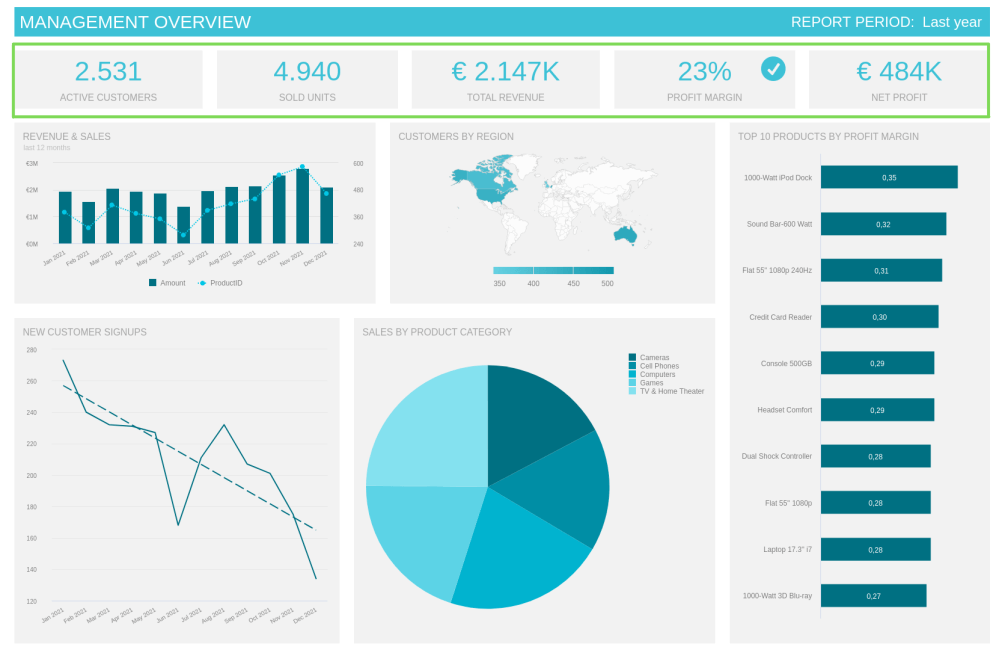
**click to enlarge**
For example, the image above shows a management dashboard with 5 number charts on the top. While it is important to know the status of these metrics, by themselves they don’t provide as much information. However, when you click on them, a drill through would allow you to get extra details or insights about that specific metric or KPI. For instance, the net profit metric that is highlighted in the report could benefit from it to see from which specific products is the profit coming. In this case, the drill is showing a pop-up with the net profit by product category, as seen in the image below.
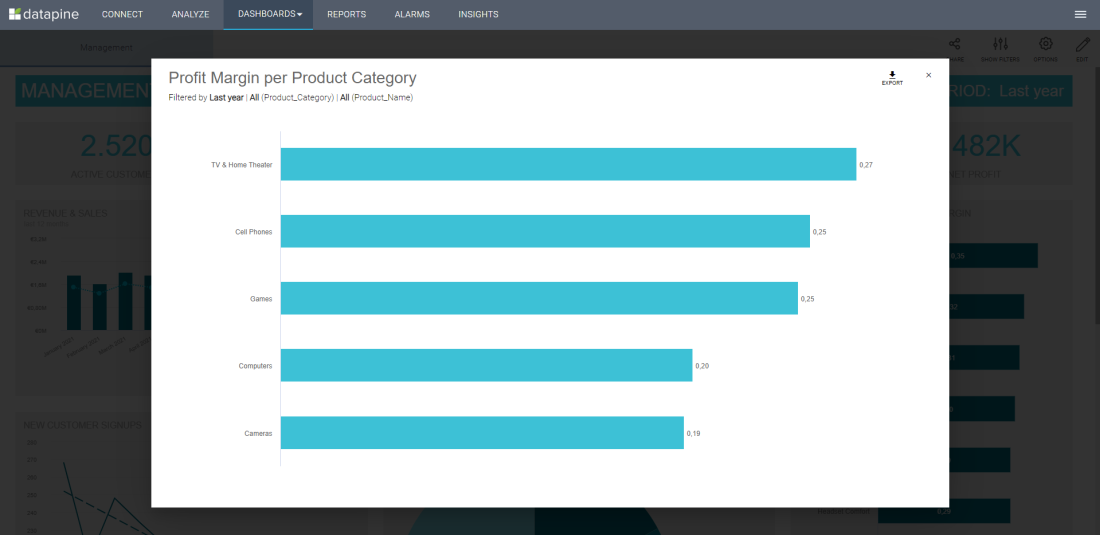
**click to enlarge**
Benefits Of Data Drill Through
Now, let’s explore the benefits of professional drill throughs.
- Centralized location for your KPIs: No matter the company's size, all departments, and activities should be connected with each other as they work towards the same general company goals. Drill throughs allow you to complement the KPIs on your dashboards or reports with additional insights without the need to jump to another location. This enables teams to stay connected with what is happening with each other and make unified and informed decisions. For example, the marketing team can have an additional drill through to look into the products that are selling the least and prepare strategies to boost them.
- Enhanced visual reports: We already mentioned this point in the benefits of drill down and we will most likely mention it again at some point later in the post as the value of visual reporting is unmatched. While traditional reports might offer contextual information using static texts, drill through are represented using different types of graphs and charts that appear in the shape of interactive pop-ups, making the information and the meaning behind it easier to understand.
We will go deeper into this and other examples later in the post. But first, let’s see what is the role of data drilling in modern online reporting.
The Role Of Data Drilling In Reporting
Drill down and throughs are two powerful features of BI reporting tools. Not only do they allow you to extract deeper insights from your data, but they also make the reporting process more intuitive and efficient. For instance, by using drill down reports you can find the answers to important questions such as your sales by country, on which channels your target customers buy the most, which product category is the most successful, and much more.
And not just that, by presenting one dimension of data at a time, these features lighten the data load making the reporting process more efficient for the end-user. Summing up to all this, they are important because:
- They allow for deeper insights: As mentioned, one of the main benefits of using drilling techniques is that they allow you to extract deeper conclusions that would otherwise remain untapped. Drill through and drill down reports can prove to be especially useful to support discussions as you can easily take complex reports and adapt them to a macro-level with just a few clicks.
- They save costs and time: No matter the type of report you are building, it can be a tedious and time-consuming task. With so many metrics and KPIs to track, businesses face the issue of building several reports for each area and goal. Data drill reports allow for a level of interactivity that makes it possible to visualize large volumes of information all in one place. In the long run, this will save your business time and money as there will be no need to generate infinite static reports.
- See data from different points of view: If you ever worked with data before, you must know that the deeper you dig the more value you will find. Drilling enables you to look at your most relevant information and visualize it from different points of view. Through this, you can discover the roots of different scenarios and build informed strategies that will set your business to succeed.
- Enhance the reporting experience: Data reporting is not an easy task. Users with no technical knowledge might struggle to go through big sets of information and extract the needed conclusions. Self-service BI tools offer intuitive drilling features that are easy to use. With just a few clicks, users from all levels of knowledge can dive into the reports and extract all the needed information in an intuitive and interactive way. Through this, the entire reporting journey will be enhanced.
Now that we have a clear understanding of what each of these techniques are and their unique benefits, let's go through some examples of drill through vs drill down analysis.
Try our professional BI reporting software for 14 days, completely free!
Drill Down vs Drill Through: Examples In Reporting
By now you should be able to understand the benefits that these two interactive features can bring to your business. To keep putting the value of these important analytical features into perspective let’s see each of them in action with some examples generated with dashboard software.
A. Drill Down Report Examples
Self service BI tools such as datapine offer drill down functionalities with just a few clicks. Alongside the possibility to drill into various levels, you can also choose the way you will interact with the drilled data. For example, you can choose to place a button at the top of the drilled chart to go back to the original data set easily, you can also tell the tool to hide any empty hierarchy levels so you can work only with information that has value. Let’s see some of these things in action.
- Customers by country and city
Our first example is a drill down graph displaying the customers by country & city. As seen in the video below, the drill feature filters the entire chart to display the number of customers from each city in Australia. We can also see how you can easily go back to check other countries by clicking on the “country” button at the top right corner. Like this, you don’t need to go into other reports or charts to go get extra insights on this data.
Another important note is that in this example we are just showing the drill from country to city, but you can go as further as your data allows it. Here you could keep drilling down into zip codes, specific stores in each city, and even top-performing sales representatives by store. This level of detail enables you to fine-tune your strategies with all the needed information.
- Customers by product category and product name
Our next example is from a table chart. As mentioned at the beginning of the post, tables are the type of online data visualization that can benefit the most from drill down analysis as they can cover several layers of information. Applying this to your tables can be useful as it allows you to place larger data sets into your reports without overcrowding them.
In the drill down visualization above we can see how it is possible to break down each of the product categories and understand which specific products are attracting the most customers. This is very valuable since it allows you to instantly compare which are your customers' favorite products and draw conclusions about future investments, and promotions, among other things.
- Customers by channel and age
The last in our list of drill down analysis examples is a bar chart tracking the number of active customers by channel and age. Once again, here we can see how easy it is to filter the entire chart based on the specific data that you want to visualize. From interns to managers, anyone can use this chart to make relevant strategic decisions.
Understanding the different age ranges of your customers depending on the channel can provide very valuable insights. For example, you can see which channels your target audience uses the most, or if you have a business that targets people of all ages, you can understand which channels to target each age group the best.
B. Drill Through Report Examples
Now that we’ve covered some insightful drill down charts examples it is time to get some visual examples of how drill throughs work in a real reporting environment. As mentioned, this is a valuable feature that allows you to navigate your data dashboards and see useful additional data without the need to overcrowd the report. Let’s see three examples more in detail.
- Profit per product category
Coming back to our first example at the beginning of the post, this management report uses drill throughs to complement the information on relevant performance metrics. Here we can see that by clicking on the net profit a pie chart is coming up as a pop-up displaying the profit of each product category. Through this, you can understand which category is bringing the most profit and focus your attention on it.
- Top 10 most sold units
Our next example is about units sold. Keeping track of the number of units sold during a given time is very important, however, this metric alone doesn’t tell us more than just a number. To extract the maximum value out of it and extract actionable conclusions, this business dashboard uses a drill through to display the top 10 most sold units from all product categories. Now, with this information in hand, we can extract conclusions about the most sold units and plan production and advertising strategies accordingly.
- Total revenue
Our last example was generated with a modern BI dashboard software and it is showing a variation of a normal drill through report. In this case, since the additional data is too big to be shown in a pop-up, the drill is working as a hyperlink to another dashboard tab that is breaking down the total revenue in areas such as sales, top products, customers worldwide, and more. This is extremely useful as it allows you to jump from different sections of your reports to others as needed. After checking the needed data, you just need to go back to your original report and move on with your analysis.
Try our professional BI reporting software for 14 days, completely free!
Key Takeaways From Drill Downs & Drill Throughs
As we reach the end of this post we hope you have a clear understanding of the value that drilling on data can bring to your reports. The key thing to remember here is that drilling data analysis will not only help you dig deeper into the roots of different scenarios going on in your business, but it will also keep you from making unnecessary expenses on generating multiple reports (which will also make you lose valuable time). Plus, the self-service nature of drill down solutions allows anyone without the need for previous technical knowledge to explore the data and extract valuable conclusions to support his or her daily work tasks.
Drill through and drill down analysis are just two of the multiple BI features you can benefit from by investing in the right technology to manage your data. Online data analysis tools such as datapine offer the possibility to efficiently analyze data by building interactive dashboards that can be used by anyone without the need for any technical skills. Making decisions based on data and not just simple intuition will lead your business to succeed.
If you are ready to start using these valuable features then try our BI reporting software for 14 days for free!