
You are the narrator of your data story. With great power comes great responsibility. You’ll need to do the following things:
Set the Context. Explain what the data story is about and why your audience should care.
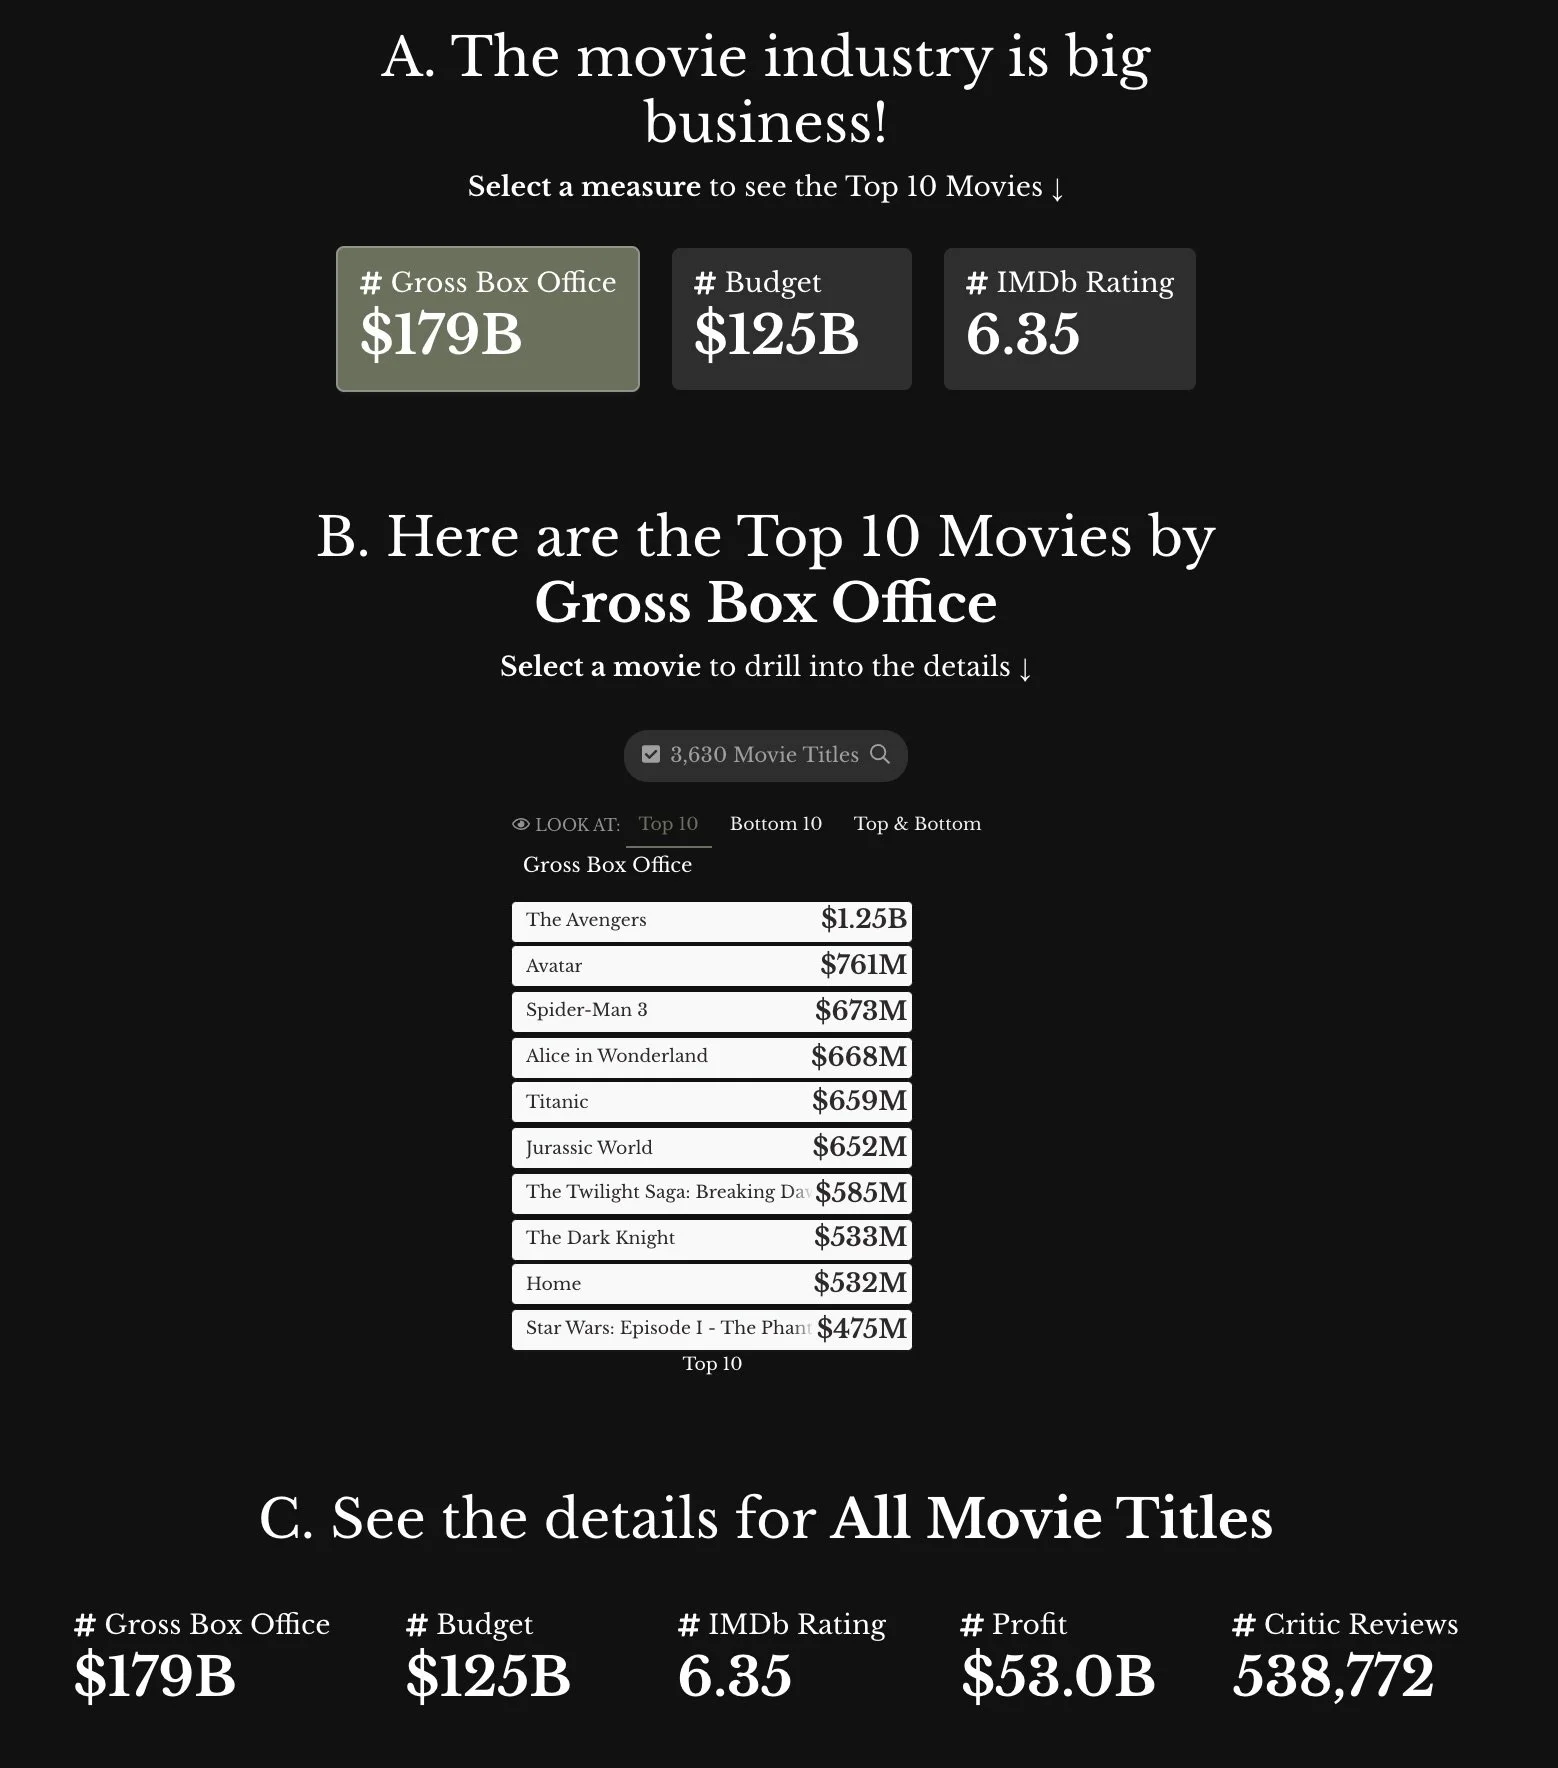
Describe the Charts What measures and dimensions are being shown? How should the chart be interpreted?
Guide the Flow. What should the reader look at next? What should they do to proceed in the story?
Highlight Insights and Actions. What's most valuable to take away from the data story? What should the reader do about it?
Let's dive a little deeper with some examples.
1. Set the Context
You want to give your readers a starting point to understand:
What is the topic of your data story?
What information they can expect to see?
Where did the data come from?
But there's more...
A short introduction to a data story.
Your audience's attention is limited. The context-setting needs to:
Be concise. Try using fewer words.
Include a "hook." Give your audience something engaging so they want to continue the journey.
2. Describe the Charts
Titles and labels on your charts are essential to ensure your audience understands what they are seeing. From abstract to specific concepts, you'll want to explain:
What question does the chart answer?
How does someone read or interpret the chart?
What measures and dimensions are being represented in the chart?
What do the chart elements (e.g. points, axes, bars, etc.) represent?
👉 How well does the chart on the right answer these questions?

3. Guide the Flow
If you aren't there to explain your data story, it is critical to provide embedded guidance to your audience. Here are a few ideas:
Use numbers or letters to indicate steps in a sequence. For example, this is the 3rd of 4 steps in this lesson.
Use arrows → or pointers 👇🏽to guide your audience's attention in the flow.
Describe the workflow with text, explaining what came before and what comes next.
Use dynamic text to connect selections from one section to the next.
4. Highlight Insights and Actions
Your data story should encourage smart decisions. As the narrator, your ultimate goal is to help your audience understand insights in the data and what it means to them, i.e. what actions they should take.
Here are a few common ways to integrate insights and actions:
Details lists to give your audience something to act on.
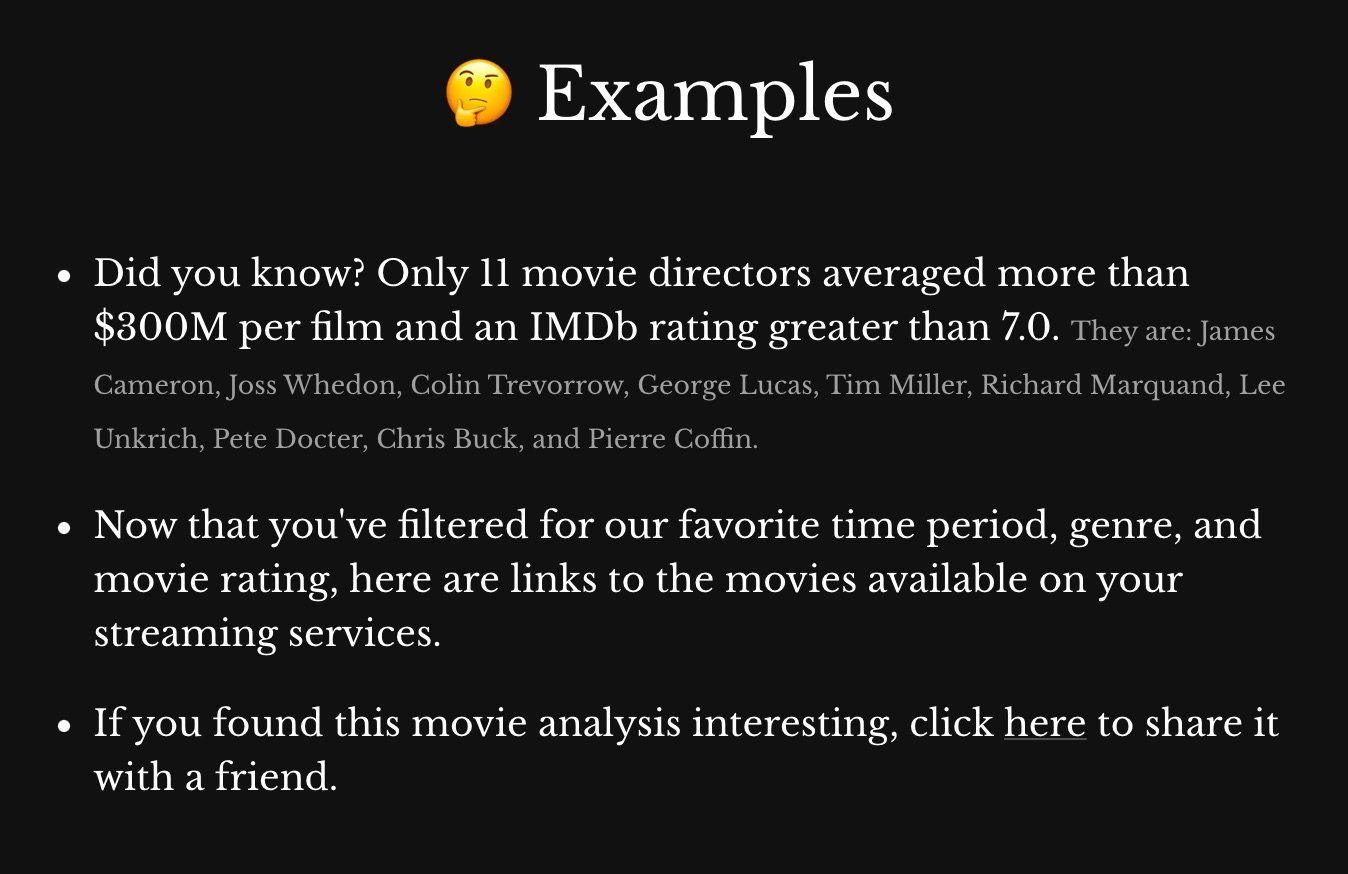
Insights from what you've found in the data.
Direct actions to link into another system.
Sharing to encourage the spread of insights across your organization
Provocative questions to encourage your audience to change their behavior based on the data.
Recommendations or resources relevant to data or insights.
If you’re looking to learn more about data storytelling, look no further than our giant collection of interactive lessons.


