Sat.Oct 13, 2018 - Fri.Oct 19, 2018

article thumbnail

What is the Decision Tree Analysis and How Does it Help a Business to Analyze Data?

ElegantJ BI

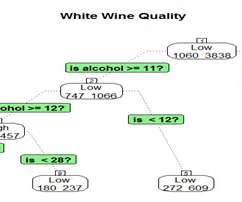
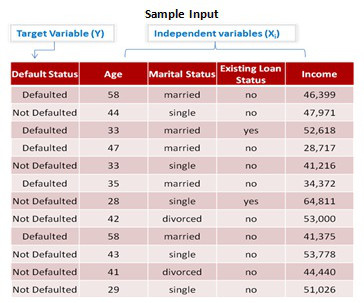
In this article, we will discuss the Decision Tree analysis method. What is Decision Tree Analysis? There are two basic types of decision tree analysis: Classification and Regression. 1) Classification Trees are used when the target variable is categorical and, as the name implies, are used to classify/divide the data into these predefined categories of a target variable.

Banking 162
article thumbnail

Women in Product Management: Louise K. Allen, SVP Product Management and Solutions Marketing at Planview

280 Group

For our next installment of the Women in Product Management Series I interviewed Louise Allen, SVP Product Management and Solutions Marketing at Planview. To read the entire series on Women in Product Management make sure to sign up for our newsletter. How did you get into Product Management? I went to school at Trinity University in San Antonio to play tennis and played professionally for 11 years after I graduated from college.

Insiders

Sign Up for our Newsletter

This site is protected by reCAPTCHA and the Google Privacy Policy and Terms of Service apply.

article thumbnail

Get The Most Out Of Your Meetings: Brush Up On Your Facilitation Skills

Business Analysis Hub

Business analysts are meant to be good at facilitating, it’s meant to be one of our key skills. However, speaking to many of the BAs in my network, facilitation is the one area that they feel that they can do more. I guess, one of the difficulties with facilitation is that you don’t always end up with a tangible outcome. This then makes it harder to determine the value in what you have achieved.

article thumbnail

Entity Relationship Diagram

The BA Doc

Are you looking for a simple way to communicate data-oriented information to both business stakeholders and the technical team? If so, you will want to know more about the Entity-Relationship Diagram (ERD). An ERD is a d.

52
article thumbnail

How to Build the Ideal HR Team

HR doesn’t exist in a vacuum. This work impacts everyone: from the C-Suite to your newest hire. It also drives results. Learn how to make it all happen in Paycor’s latest guide.

article thumbnail

What is the Independent Samples T Test Method of Analysis and How Can it Benefit an Organization?

ElegantJ BI

This article focuses on the Independent Samples T Test technique of Hypothesis testing. What is the Independent Samples T Test Method of Hypothesis Testing? The independent sample t-test is a statistical method of hypothesis testing that determines whether there is a statistically significant difference between the means of two independent samples. For example, one might use this method of analysis to determine whether the average value of a sedan type of car is significantly different from an S

More Trending

article thumbnail

SoundNotes Live: Q&A Session w/ Mike Cottmeyer vol.2

Leading Agile

?. Once again, Mike Cottmeyer and Dave Prior sat down to discuss some of Mike’s latest thoughts on Agile Transformation and answer questions that we received from the audience. Some of the topics discussed were: Agile PMO, velocity, and governance just to name a few. These live Q&A sessions will be recurring, so make sure you’re on the lookout for the next installment.

article thumbnail

Our new Lifeboat partnership extends our reach with Cloud, Mobile and IoT Developers

Actian

This week Lifeboat announced their new contract to distribute our Actian product lines through their vast reseller channels as well as direct to their customers (you can find details here ). Speaking as the Actian Product Management and Marketing lead for one of those product lines, the Actian Zen Edge database family, this is a major step forward for us.

article thumbnail

What is Multiple Linear Regression and How Can it be Helpful for Business Analysis?

ElegantJ BI

This article describes the analytical technique of multiple linear regression. What is Multiple Linear Regression Analysis? Multiple Linear Regression is a statistical technique that is designed to explore the relationship between two or more variables (X, and Y). It is useful in identifying important factors (X,) that will impact a dependent variable (Y), and the nature of the relationship between each of the factors and the dependent variable.

article thumbnail

Entity Relationship Diagram

The BA Doc

An Entity Relationship Diagram (ERD) is a data modeling technique that illustrates the relationships between different elements within a system. ERDs are generally used to design relational databases in technical areas.

article thumbnail

How to Stay Competitive in the Evolving State of Martech

Marketing technology is essential for B2B marketers to stay competitive in a rapidly changing digital landscape — and with 53% of marketers experiencing legacy technology issues and limitations, they’re researching innovations to expand and refine their technology stacks. To help practitioners keep up with the rapidly evolving martech landscape, this special report will discuss: How practitioners are integrating technologies and systems to encourage information-sharing between departments and pr

article thumbnail

Zen and Code Maintenance

Leading Agile

Warning: This may be a little bit preachy. If so, it’s only because I’m a little bit frustrated by it. Tying Up Loose Ends at Home. We’ve had a bad habit at our house over the years. When we used a tool, we’d neglect to put it back in its proper place. The next time someone needed the tool, we’d spend more time looking for it than it took to use it for the task at hand.

Planning 104
article thumbnail

Airplane Mode aka The Cloud Digital Divide

Actian

I recently took a last-minute trip from San Francisco to India. The best fare in economy I could find was on a sixteen-hour Air India flight, direct to New Delhi. I figured I’d get a lot of work done on the flight and, if not, at least I could catch-up on movie watching. Turns out I was zero for two on this as my in-seat entertainment center didn’t work and I couldn’t get much of my work done either – I guess that means I was two for two on being surprised.

Digital 40
article thumbnail

What is KNN Classification and How Can This Analysis Help an Enterprise?

ElegantJ BI

In this article, we will discuss the KNN Classification method of analysis. What is the KNN Classification Algorithm? The KNN (K Nearest Neighbors) algorithm analyzes all available data points and classifies this data, then classifies new cases based on these established categories. It is useful for recognizing patterns and for estimating. Let’s say we want to determine the likelihood of loan default based on two predictors (age and loan type), with ‘default’ being the target.

Banking 130
article thumbnail

What is the Independent Samples T Test Method of Analysis and How Can it Benefit an Organization?

ElegantJ BI

This article focuses on the Independent Samples T Test technique of Hypothesis testing. What is the Independent Samples T Test Method of Hypothesis Testing? The independent sample t-test is a statistical method of hypothesis testing that determines whether there is a statistically significant difference between the means of two independent samples. For example, one might use this method of analysis to determine whether the average value of a sedan type of car is significantly different from an S

article thumbnail

Maximize Productivity and Simplify IT Management with Conversational AI

ChatGPT has dominated boardroom conversations for months now. From drafting a stock trading program, to creating a SQL query to model data, there are practically no limits to the applications of the AI language model assistant. At ManageEngine, we have been working on our own AI-assistant, Zia. Zia is a fully-trained analytics assistant that can perform a range of functions such as creating and adding reports to dashboards, providing conversational support to data analysis, insight discovery, bu

article thumbnail

What is Multiple Linear Regression and How Can it be Helpful for Business Analysis?

ElegantJ BI

This article describes the analytical technique of multiple linear regression. What is Multiple Linear Regression Analysis? Multiple Linear Regression is a statistical technique that is designed to explore the relationship between two or more variables (X, and Y). It is useful in identifying important factors (X,) that will impact a dependent variable (Y), and the nature of the relationship between each of the factors and the dependent variable.

article thumbnail

What is KNN Classification and How Can This Analysis Help an Enterprise?

ElegantJ BI

In this article, we will discuss the KNN Classification method of analysis. What is the KNN Classification Algorithm? The KNN (K Nearest Neighbors) algorithm analyzes all available data points and classifies this data, then classifies new cases based on these established categories. It is useful for recognizing patterns and for estimating. Let’s say we want to determine the likelihood of loan default based on two predictors (age and loan type), with ‘default’ being the target.

Banking 130
article thumbnail

What is the Independent Samples T Test Method of Analysis and How Can it Benefit an Organization?

ElegantJ BI

This article focuses on the Independent Samples T Test technique of Hypothesis testing. What is the Independent Samples T Test Method of Hypothesis Testing? The independent sample t-test is a statistical method of hypothesis testing that determines whether there is a statistically significant difference between the means of two independent samples. For example, one might use this method of analysis to determine whether the average value of a sedan type of car is significantly different from an S

article thumbnail

What is Multiple Linear Regression and How Can it be Helpful for Business Analysis?

ElegantJ BI

This article describes the analytical technique of multiple linear regression. What is Multiple Linear Regression Analysis? Multiple Linear Regression is a statistical technique that is designed to explore the relationship between two or more variables (X, and Y). It is useful in identifying important factors (X,) that will impact a dependent variable (Y), and the nature of the relationship between each of the factors and the dependent variable.

article thumbnail

Data-Backed Secrets for Minimizing Discounts & Maximizing ROI Post-Holiday

Use data to turn one-off holiday shoppers into repeat buyers and effortlessly drive more sales throughout the year. Our guide will give you an in-depth understanding of what triggers your customers to buy and breaks down campaign examples from leading B2C brands.

article thumbnail

What is KNN Classification and How Can This Analysis Help an Enterprise?

ElegantJ BI

In this article, we will discuss the KNN Classification method of analysis. What is the KNN Classification Algorithm? The KNN (K Nearest Neighbors) algorithm analyzes all available data points and classifies this data, then classifies new cases based on these established categories. It is useful for recognizing patterns and for estimating. Let’s say we want to determine the likelihood of loan default based on two predictors (age and loan type), with ‘default’ being the target.

Banking 130
article thumbnail

What is Karl Pearson Correlation Analysis and How Can it be Used for Enterprise Analysis Needs?

ElegantJ BI

This article explains the Karl Pearson Correlation method of analysis, and how it can be applied in business. What is the Karl Pearson Correlation Analytical Technique? Correlation is a statistical measure that indicates the extent to which two variables fluctuate together. A positive correlation indicates the extent to which those variables increase or decrease in parallel.

article thumbnail

What is ARIMAX Forecasting and How is it Used for Enterprise Analysis?

ElegantJ BI

This article looks at the ARIMAX Forecasting method of analysis and how it can be used for business analysis. What is ARIMAX Forecasting? An Autoregressive Integrated Moving Average with Explanatory Variable (ARIMAX) model can be viewed as a multiple regression model with one or more autoregressive (AR) terms and/or one or more moving average (MA) terms.

article thumbnail

What is Simple Linear Regression and How Can an Enterprise Use this Technique to Analyze Data?

ElegantJ BI

This article describes the Simple Linear Regression method of analysis. What is Simple Linear Regression? Simple Linear Regression is a statistical technique that attempts to explore the relationship between one independent variable (X) and one dependent variable (Y). This method helps a business to identify the relationship between X and Y and the nature and direction of that relationship.

article thumbnail

The Complete People Management Toolkit

From welcoming new team members to tough termination decisions, each employment lifecycle phase requires a balance of knowledge, empathy & legal diligence.

article thumbnail

What is the Paired Sample T Test and How is it Beneficial to Business Analysis?

ElegantJ BI

This article discusses the Paired Sample T Test method of hypothesis testing and analysis. What is the Paired Sample T Test? The Paired Sample T Test is used to determine whether the mean of a dependent variable e.g., weight, anxiety level, salary, reaction time, etc., is the same in two related groups. For example, one might consider two groups of participants that are measured at two different “time points” or two groups that are subjected to two different “conditions”

article thumbnail

What is Binary Logistic Regression Classification and How is it Used in Analysis?

ElegantJ BI

In this article, we will discuss the Binary Logistic Regression Classification method of analysis, and how it can be used in business. What is Binary Logistic Regression Classification? Logistic regression measures the relationship between the categorical target variable and one or more independent variables. It is useful for situations in which the outcome for a target variable can have only two possible types (in other words, it is binary).

Logistics 130
article thumbnail

What is Karl Pearson Correlation Analysis and How Can it be Used for Enterprise Analysis Needs?

ElegantJ BI

This article explains the Karl Pearson Correlation method of analysis, and how it can be applied in business. What is the Karl Pearson Correlation Analytical Technique? Correlation is a statistical measure that indicates the extent to which two variables fluctuate together. A positive correlation indicates the extent to which those variables increase or decrease in parallel.

article thumbnail

What is ARIMAX Forecasting and How is it Used for Enterprise Analysis?

ElegantJ BI

This article looks at the ARIMAX Forecasting method of analysis and how it can be used for business analysis. What is ARIMAX Forecasting? An Autoregressive Integrated Moving Average with Explanatory Variable (ARIMAX) model can be viewed as a multiple regression model with one or more autoregressive (AR) terms and/or one or more moving average (MA) terms.

article thumbnail

ABM Evolution: How Top Marketers Are Using Account-Based Strategies

In times of economic uncertainty, account-based strategies are essential. According to several business analysts and practitioners, ABM is a necessity for creating more predictable revenue. Research shows that nearly three-quarters of marketers (74%) already have the resources needed to build successful ABM programs.